Demography of rare mutations (population genetics)
The content on this page was written by AI under human supervision.
In two papers, Matthew Schwartz and Michael Desai infer natural selection and ancestry from variant frequencies in large public DNA samples. The first evaluates a 1992 formula for the effect of selection on those frequencies exactly, in cases where ordinary computer arithmetic fails, and applies it to the protein-coding DNA of about 730,000 people. The second counts 5.7 billion pairs of nearby variants in the genomes of 113 Gambians and finds a departure from the textbook model of ancestry, most of which is explained by gene conversion, a process that standard analyses leave out.
Two mutations at a time — a hand-drawn six-minute telling of the second paper on this page: how counting pairs of nearby mutations in 113 Gambian genomes shows that a model with gene conversion, left out of standard analyses, accounts for about 95 percent of their departure from the standard picture, and why in Zambian fruit flies the same test still fails with conversion added, while shared fly haplotypes point instead to lineages that merge many at a time. (Download the video, 14 MB.)
One mutation at a time
Sample $n$ chromosomes today and count the variants carried by exactly one of them, by two, and so on. The resulting histogram is the site-frequency spectrum, in use since Kimura in 1969, and most inference in population genetics comes from fitting models to it. Ancestry and selection both shape it. Going back in time, the sample descends from fewer and fewer ancestors. In the standard description, the coalescentThe random family tree of a sample of chromosomes traced backward in time; in Kingman's 1982 version ancestral lines merge two at a time, at a rate inversely proportional to the population size. of Kingman (1982), ancestral lines merge two at a time, faster when the population is small. In a population that has recently grown, lines merge slowly near the present, so expansions inflate the rare end of the histogram and bottlenecks deplete it. As for selection, a harmful mutation is removed before it can spread, so the more harmful a class of variants, the more it concentrates at the rare end. The distribution of fitness effects across new mutations, the DFE, can in principle be read from the shape of the spectrum.
The theory behind such readings is the Poisson random field of Sawyer and Hartl (1992). Write $S = 4N_e s$, where $s$ is the mutation's fractional effect on fitness, negative when harmful, and $N_e$ the effective population sizeThe size of an idealized randomly mating population with the same amount of random genetic drift as the real one; the textbook long-term human value is about 15,000.. For a population of constant size and an additive mutation (one copy doing half the harm of two), the expected number of sites whose variant is carried by $i$ of the $n$ sampled chromosomes is
$$\xi_i(S) \;=\; \theta \binom{n}{i} \int_0^1 x^{\,i-1}(1-x)^{\,n-i-1}\, \frac{1-e^{-S(1-x)}}{1-e^{-S}}\, dx .$$Here $x$ is the variant's unobserved frequency in the whole population, integrated out, and $\theta$ sets the mutation rate. The binomial coefficient times $x^{i}(1-x)^{n-i}$ is the chance that a variant at frequency $x$ is caught exactly $i$ times. The remaining factor, $[1-e^{-S(1-x)}]/[(1-e^{-S})\,x(1-x)]$, is proportional to how long a variant under selection $S$ spends near frequency $x$ before it is lost or takes over. Mixing the formula over a DFE and matching an observed histogram is the core of the standard programs polyDFE, fitdadi and fastDFE, and the modern picture of the human DFE comes from such fits.
Why sixteen digits are not enough
The integral for $\xi_i(S)$ has a closed form in the confluent hypergeometric function, and neighboring entries obey a three-term recurrence with both end values known exactly. The recurrence is a trap, because it has two independent solutions: the physical one, with entries of order one, and an unphysical companion that is astronomically larger, already at least $10^{83}$ for 100 chromosomes at $S=\pm10$. Every rounding error injects a little of the companion, which then swamps the answer. Solving for all entries at once gives numbers that satisfy the equations to rounding error and can still share no digits with the true values, because the companion satisfies the same equations. No check at fixed precision detects the error.
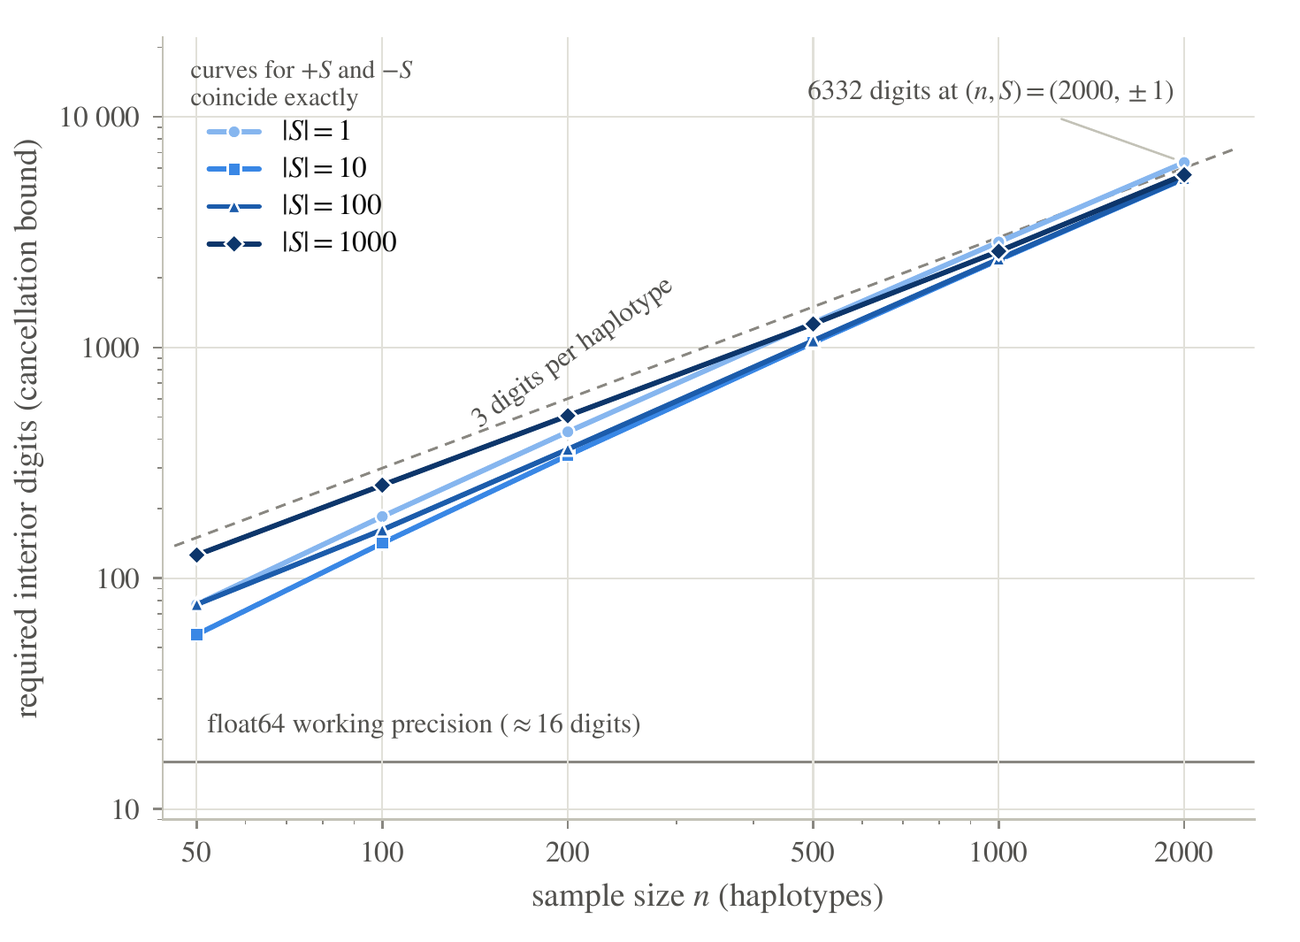
Decimal digits that must be carried to evaluate the whole selected spectrum by recurrence or simultaneous solve, against sample size, for four selection strengths. The requirement grows by about three digits per sampled chromosome and reaches 6,332 digits at $n=2000$; ordinary double precision supplies sixteen (horizontal line), already insufficient at $n=50$. Fixed-precision arithmetic cannot evaluate the spectrum at modern sample sizes. (Figure 1 of the first paper.)
The first paper evaluates the spectrum without any rounding. For rational $S$, every entry $M_i$ of the hypergeometric vector behind the spectrum has the form
$$M_i \;=\; \alpha_i + \beta_i\, e^{-S}, \qquad \alpha_i,\ \beta_i \in \mathbb{Q},$$a fraction plus a fraction times one exponential ($\mathbb{Q}$ denotes the rational numbers). With the two end values known, the linear system splits into two systems over the rationals, which are solved exactly. The companion reappears as the size of the fractions' numerators and denominators, where it does no harm and bounds the cancellation in advance. This route is practical to about 2,000 chromosomes. Beyond that, the recursion is run in ball arithmetic, in which every number carries a rigorous error radius, out to $n=10^5$. Above a million chromosomes, the scale of the catalog analyzed below, each needed entry is instead summed as an arbitrary-precision series to 30 significant digits with its own error bound. The construction extends, with controlled error, to arbitrary dominance, the share of a mutation's harm already felt in one copy.
Broken genes in 730,000 exomes
A harmful variant at strength $S$ circulates at frequencies near $1/|S|$, so at classical sample sizes everything from $|S|=10^2$ to $10^5$ falls in the first cell or two of the histogram. The v4.1 exomeThe protein-coding part of the genome, about one percent of its length; exome sequencing reads only those regions. release of the public gnomAD database pools 730,947 people, up to 1,461,894 sampled chromosomes per position, and at that depth the whole range lies inside the observable spectrum. The authors fit the deleterious DFE to the rare end for missense variants, which swap one amino acid, and for high-confidence loss-of-functionA variant predicted to destroy the gene's product outright, for example a premature stop codon or a broken splice site. variants. They absorb population history by calibrating on synonymous variants, which change the DNA but not the protein, as the standard programs do. The strong tail of the DFE is modeled as eight free bins of mass between $|S|=10^2$ and $10^5$; because simulated data showed that single bins are not identifiable, only totals over three wide windows of $|S|$ are reported.
![Two panels. (a) Log-log plot of segregating sites per unit allele count against allele count AC from 1 to about 2,300, for three variant classes in gnomAD v4.1: synonymous (gray circles, dotted line), missense (blue squares, dashed line) and high-confidence loss-of-function (orange triangles, solid line). Points are observed counts and lines are the fitted expected spectra; all three fall steeply and nearly straight, from roughly 5 million (missense), 2 million (synonymous) and 300,000 (loss-of-function) at AC = 1 down to under 10, about 5 and about 0.1 at the right edge, with the fitted lines passing through the points. (b) Bar chart of fitted deleterious DFE mass fraction (0 to 1) in three windows of |S|: [10^2, 10^3], [10^3, 10^4] and [10^4, 10^5], for missense (solid blue) and loss-of-function (hatched orange), each with a vertical 95 percent interval. In the first window missense is about 0.32 with an interval reaching about 0.86 and loss-of-function about 0.15 with an interval to about 0.40; the middle window has zero-height bars with intervals to about 0.57 and 0.33; in the deepest window missense is about 0.29 (interval about 0.08 to 0.43) and loss-of-function about 0.74 (interval about 0.57 to 0.84). Small diamonds beside the deepest bars mark the top-bin maximum-likelihood point, labeled [4.2×10^4, 10^5] (point, no interval).](/img/popgen-gnomad-tail.png?v=b7b348c953)
Left: the rare end of the gnomAD v4.1 exome spectrum for synonymous, missense and high-confidence loss-of-function variants (points) with the fitted expected spectra (lines); the fits use allele counts up to 5,000. Right: the fitted share of each class's deleterious DFE in three windows of scaled selection strength, with 95% intervals that include the model's measured misfit. The deepest window holds about three quarters of the loss-of-function mass and somewhat more than a quarter of the missense mass; the middle window is empty only at the best-fit point, since its intervals reach 0.33 and 0.57. (Figure 2 of the first paper.)
For loss-of-function variants, 73.6% of the fitted deleterious DFE lies at $|S|$ between $10^4$ and $10^5$, with a 95% interval of 57.4% to 83.6% that has the model's measured misfit built in. For missense the same window holds 28.5% (7.7% to 42.7%). Converting the window to a fitness cost requires a choice of $N_e$, which the authors leave open. At the textbook long-term human value, $1.5\times10^4$, most gene-disabling mutations would be close to lethal in one copy; at the larger effective sizes of recent growth, the window's edge is a cost near 2% in one copy.
Dominance is harder to read: at these frequencies essentially nobody carries two copies, so ordinary chromosomes measure only the product of dominance and strength. The X chromosome, where males carry one copy, partly separates them. With the ratio of X to autosome effective size fixed at its neutral reference value of 0.75, the lower bound on the baseline dominance coefficient $h_0$ of loss-of-function variants falls somewhere between 0.5 and 0.934, so a gene-disabling mutation appears to do more than half its harm in the first copy. For missense it falls between 0.15 and 0.5; both are bounds at that assumed ratio, not confidence intervals.
When population history mimics selection
Expansions inflate rare variants just as selection against harmful mutations (purifying selection) does, and Myers, Fefferman and Patterson showed in 2008 that different histories can give identical neutral spectra. Schwartz and Desai ask, at sample size $n=20$, whether any size history of a well-mixed population with Kingman ancestry reproduces the expected spectrum of a selected site. A representation lemma proved in the paper shows that the spectrum of every such history is a weighted average of points on one explicit polynomial curve. A selected spectrum then lies inside that curve's convex hull or outside it, and either case can be proved in exact arithmetic unless the margin is too small to resolve. At every weak strength sampled, from $S=-10$ to $+1.125$, the authors exhibit an explicit eighteen-epoch neutral history whose spectrum matches the selected one to within about $10^{-11}$: history genuinely mimics weak selection. Stronger selection gives the opposite result in the cases the authors treat: every sampled beneficial strength from $S=1.375$ to $100$ in the additive case, where each copy of the mutation contributes equally, and twenty-five combinations of strength and dominance in all. For each they exhibit an affine functional, a weighted sum of the entries plus a constant. Each functional is proven nonnegative along the whole curve and negative at the selected spectrum, so no history in the class reproduces those spectra. All of this holds for well-mixed populations with Kingman ancestry at $n=20$ only; structured populations, and genealogies in which lines merge many at a time, are not excluded.
Exact values of the spectrum also allow the accuracy of the standard programs to be measured. When identical data are refitted with each program's numerics and with the exact likelihood, the fits from polyDFE, fitdadi and fastDFE agree with the exact one to within a small fraction of a confidence interval at the sample sizes for which they were developed. They lose accuracy in three settings: polyDFE with beneficial mass above $S\approx38$ at samples above about 90 chromosomes, fitdadi's 2017 rule for DFE mass beyond its selection grid, and sample sizes of order $10^5$, which none of the three handles in the versions tested. The authors find no reason to revisit published deleterious-DFE estimates made with current defaults, though estimates that fall in the first two settings may warrant re-examination.
Two mutations at a time
The single-site histogram has a blind spot: different ancestries can produce the same spectrum. Several recent studies argue that multiple mergers, genealogies in which one ancestor occasionally leaves many descendants at once, are widespread and can mislead Kingman-based inference. In 2025 Fenton, Rice, Novembre and Desai proposed a statistic that can detect them. For pairs of nearby variable sites, record how many sampled chromosomes carry the mutated, or derived, allele at the first, $i$, and at the second, $j$; the table of pair fractions over $(i,j)$ is the two-site frequency spectrum. Two close sites share a genealogical tree, and how often their mutations fall in the same individuals depends on its branching structure, which multiple mergers alter. Applied to Drosophila melanogaster, their test rejected the Kingman coalescent genome-wide.
The second paper applies the test to 113 unrelated Gambians from the high-coverage 1000 Genomes panel. The authors count pairs of variable sites on the non-sex chromosomes, the autosomes, up to 100,000 base pairs apart: 5.7 billion pairs in all. The pairs are binned by genetic-map distance, which measures how often the reshuffling of chromosomes between generations separates two points. The primary analysis takes the 590 million most closely linked pairs, whose map distance is indistinguishable from zero. Each pair's counts among the 226 chromosomes are averaged exactly over every subsample of four people, $n=8$, which leaves a table of 28 cells. The expected spectrum of fully linked sites is computed exactly for any piecewise-constant history of up to 24 epochs and any mixture of such histories across genomic regions. The smallest distance from the data to that entire Kingman class can therefore be computed with a guarantee that no member of the class comes closer.
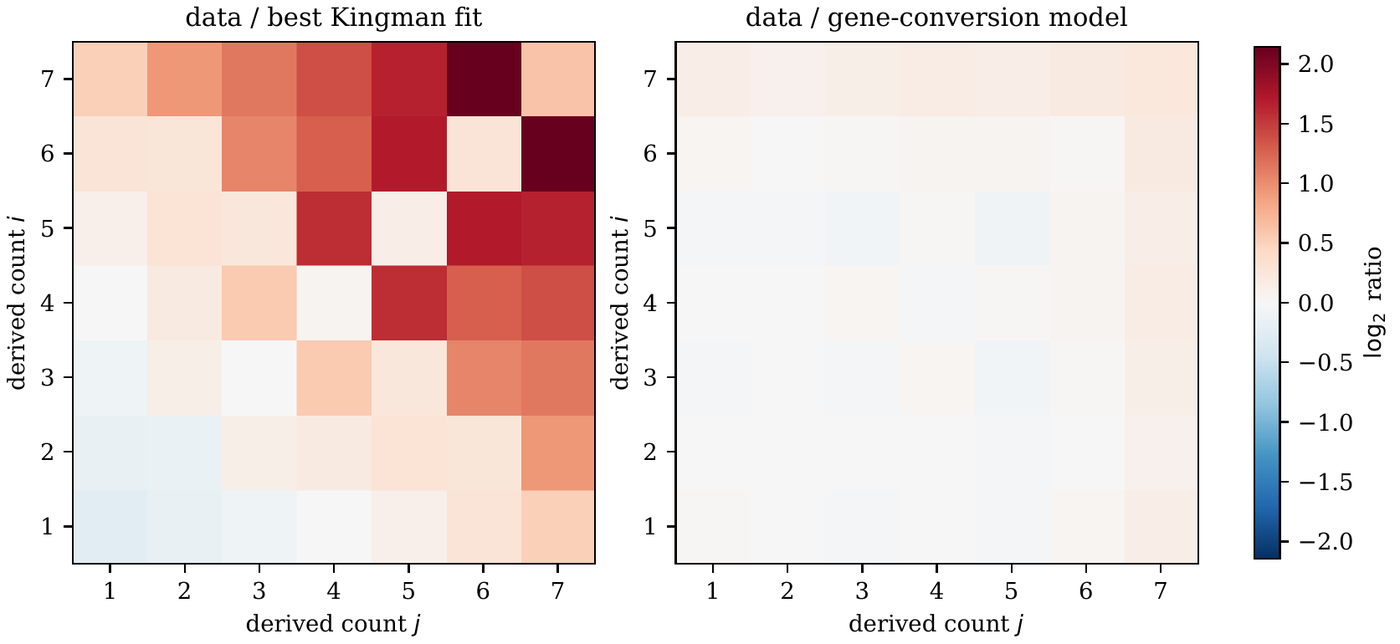
The two-site spectrum of the 590 million most closely linked pairs in the genomes of 113 Gambians, as the base-2 logarithm of observed over predicted in each cell. Left: against the best fit from the entire class of Kingman histories; the excess grows toward pairs of high-frequency alleles, peaks at 4.8 times the prediction in cell $(6,7)$, and is largely absent on the diagonal. Right: against the fitted Kingman model with gene conversion and ancestral mislabeling, on the same color scale; little structure remains. (Figure 2 of the second paper.)
No Kingman history fits the Gambian pair spectrum: the best member of the whole class misses the data by $\chi^2 = 7{,}697$ on 27 degrees of freedom, more than two hundred times the rejection threshold of 29.2 set by the measured sampling noise. The margin survives every analysis choice the authors varied, and the misfit points the same way on each of the nineteen autosomes used.
Seven candidate explanations
Seven candidate processes are then simulated: gene conversion, crossover-map error, Beta-coalescent multiple mergers, sequencing error, population structure, linked selection, and mislabeling of the ancestral allele. From each simulated spectrum its own best Kingman refit is subtracted, which removes whatever a change of history could absorb. The strength of each process is capped by a direct measurement where one exists and otherwise by a deliberately strong scenario.
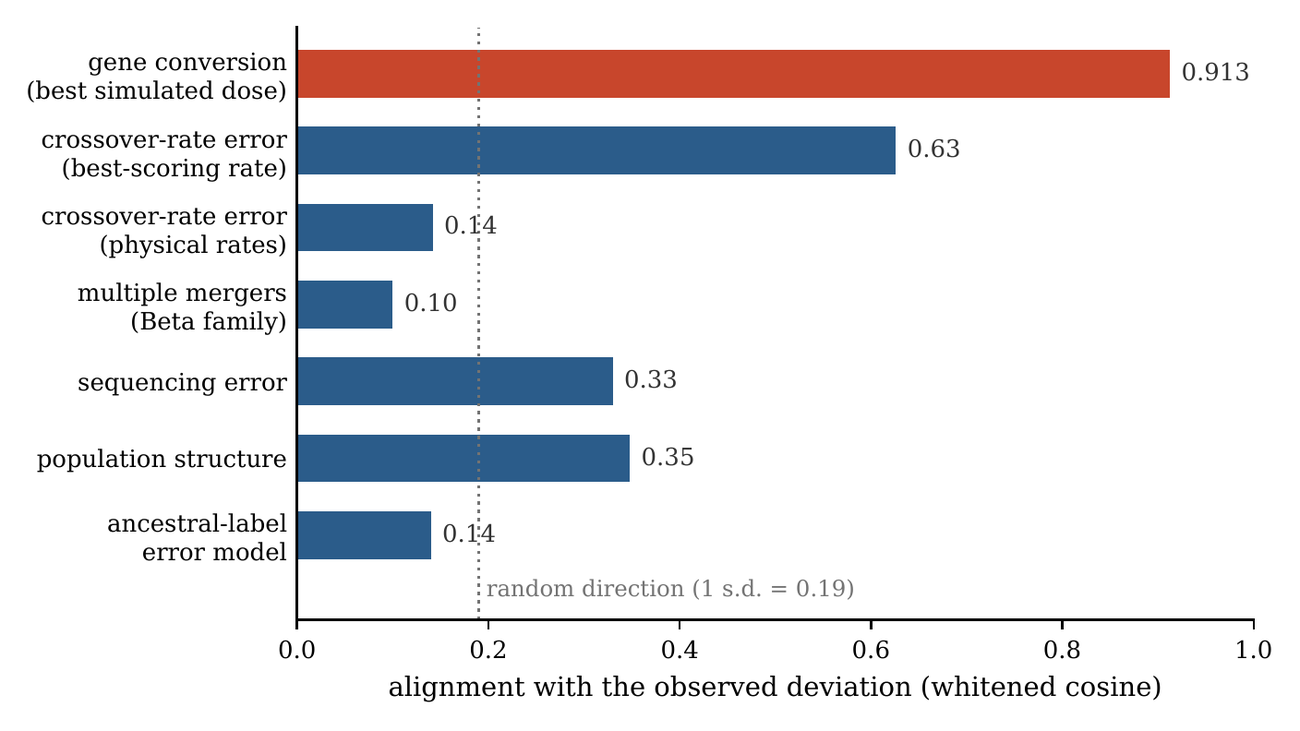
How well the direction in which each candidate process moves the two-site spectrum lines up with the observed deviation, as a cosine in the noise-whitened cell space; the dotted line is the spread of a random direction. Gene conversion reaches 0.913. A crossover-map error reaches 0.63 only at its best-scoring rate and 0.14 at physically plausible rates, and the multiple-merger family is at 0.10, indistinguishable from chance. (Figure 4 of the second paper.)
Only gene conversion moves the spectrum in the direction of the observed deviation. The Beta-coalescent family of multiple mergers scores no better than a random direction, although the test is well powered against that family. The six other processes together, within their bounds, remove 74.0% of the deviation, against 95.2% for the gene-conversion model. In contrast to the fly result, multiple mergers need not be invoked in these human data.
Gene conversion comes from the same machinery that makes crossovers when sperm and eggs form. Instead of swapping long segments between the two copies of a chromosome, it copies a short patch, tens to hundreds of base pairs, from one copy onto the other. Analyses of linked variation usually omit it. The fitted model keeps Kingman ancestry under a freely fitted history $\mathbf{w}$ and adds conversion in two tract-length classes plus a mislabeling rate:
$$\phi^{\rm model} \;=\; F_{\varepsilon}\!\left[\, \phi^{\rm K}(\mathbf{w}) \;+\; \lambda_{\rm short}\, D_{L_{\rm short}} \;+\; \lambda_{500}\, D_{500} \,\right].$$Here $\phi^{\rm K}(\mathbf{w})$ is the exact Kingman two-site spectrum under history $\mathbf{w}$. $D_L$ is the simulated shift in the 28 cells from conversion tracts of mean length $L$. The short class has $L_{\rm short}=110$ base pairs, the value measured in sequenced families (pedigrees), and the long class 500. Each rate $\lambda$ is the per-base-pair, per-generation probability that a site lies inside a transferred tract, and $F_\varepsilon$ reverses the ancestral label at a fraction $\varepsilon$ of sites, sending count $i$ to $8-i$. Fitted jointly with the history, so that nothing demography could explain is credited to conversion, the model removes 94.2% to 96.2% of the deviation across analysis choices; in the reference analysis $\chi^2$ falls from 7,697 to 370.2. The mislabeling rate comes out at $\varepsilon = 1.67\%$.
The fitted total conversion rate, $8.33\times10^{-6}$ per base pair per generation, is of the same order as pedigree and sperm-typing measurements. The total is the well-determined quantity and the split between classes is soft; even the total, though, is known in absolute terms only to roughly a factor of two, and every rate scales with the assumed mutation rate. With its parameters fixed on the most closely linked pairs, the model predicts the deviation at other separations; in a separate pair set, binned by physical separation, the measured deviation matches the prediction within 3% at 200 and 1,500 base pairs and falls 9% short of it at 650. Where crossovers dominate the prediction, at separations of a few thousand base pairs, the model misses by 10 to 30%, a tilt across separations that no choice of crossover rate removes. The 1000 Genomes Yoruba cohort and an independently processed callset give the same deviation and parameters within about a standard deviation. All these samples are West African and the two cohorts share most variant sites, so this is a consistency check more than independent confirmation.
Flies, and what remains open
When the fruit-fly code released by Fenton and colleagues is rerun with conversion added at measured fly rates, the test still rejects Kingman ancestry for the flies. Haplotypes, the sequences of variants along single chromosome copies, in 197 Zambian D. melanogaster genomes point to the kind of departure involved. In windows of fifty variable sites, matched on the fraction of identical pairs, the largest groups of flies sharing one haplotype run about a fifth to a quarter larger than Kingman genealogies produce. The excess appears on three autosome arms and the X, the pattern expected when single ancestors occasionally leave many descendants. It remains open whether the mergers come from sweepstakes reproduction, in which a few individuals leave much of the next generation, or from recurrent selective sweeps, in which favored mutations drag their neighborhoods along. The Gambian haplotypes show no comparable cluster excess, only raised pairwise identity persisting across chromosomes, which relatedness and structure can produce.
In the human pair data 4.8% of the deviation remains after the fit, well above noise and concentrated where one site's allele is carried by seven of eight chromosomes. Below about 100 base pairs the data exceed the model by up to an order of magnitude, roughly half of it from mutations that strike neighboring sites together, and the model should not be applied there. The short-tract rate alone, $1.22\times10^{-6}$, is a factor of 2 to 8 below pedigree counts. The authors examine this gap in four ways without resolving it. On the single-site side, whether history can mimic strong purifying selection is also unresolved, and the error control covers the arithmetic, not the model's assumptions of independent sites and an equilibrium population.
The papers
- An exact solution for the site-frequency spectrum of a selected allele (PDF) — Matthew D. Schwartz and Michael M. Desai; currently marked preliminary. Contains the exact evaluation of the selected site-frequency spectrum, the fit to the gnomAD v4.1 exomes with the X-chromosome bounds on dominance, the analysis at $n=20$ of when population history can mimic selection, and the accuracy measurements of polyDFE, fitdadi and fastDFE.
- Signatures of gene conversion in the human two-site frequency spectrum (PDF) — Matthew D. Schwartz and Michael M. Desai; currently marked preliminary. Contains the two-site test on the 113 Gambian genomes, the simulations of the seven candidate processes, the Kingman model with gene conversion and its predictions at other separations and in a second cohort, and the fruit-fly haplotype analysis. It ends with a section on how its computations were carried out by Claude under the authors’ direction, and how they were checked.
Supplementary material
The importable popcorn library implements the first paper’s exact computation. It is hosted on this site as two archives that unpack side by side, with the manual, a provenance note and a checksum manifest beside them.
- Popcorn — the library’s page among this site’s tools: what each module does, the one-line reproduce command, its validation numbers and scope, the conventions ($S=4N_e s$, unfolded derived-allele spectrum), and the same download links as below.
- popcorn-package.tar.gz — the popcorn package exactly as it appears in the BootLoops repository (version 1.0), as one archive: the exact and ball-arithmetic site-frequency-spectrum engines with their certificate routes, the DFE layer and dominance modules, and four further members (exact $\Lambda$-coalescent spectra, a two-locus engine, a transient selected spectrum for large samples, and an ancestral-allele join for polarizing variants). Python 3 with mpmath for the core; python-flint, gmpy2, numpy with scipy, and sympy each enable further routes and tests, which are skipped by name without them.
python3 selftest.pyinside the unpacked folder runs the test suite and prints one line per test and an overall verdict. - popgen-dfe-release.tar.gz — the first paper’s evaluator bundle: the engine modules and the frozen outputs of the validation runs, including the parameter-level comparisons with polyDFE, fitdadi and fastDFE, each file verified against a SHA-256 digest before use.
- MANUAL.md — the package guide from the repository: purpose, when to use it and when not, the command-line and library entry points, inputs and outputs, requirements, the test suite and known pitfalls.
- MANIFEST.sha256 — SHA-256 digests of the two archives and MANUAL.md;
sha256sum -c MANIFEST.sha256verifies a download.
The first paper states that its code and data package will be deposited in a public repository on acceptance, and the second that its code and intermediate outputs will be deposited on publication. The gnomAD, 1000 Genomes, HGDP and deCODE data are public.
References
| M. Kimura, The number of heterozygous nucleotide sites maintained in a finite population due to steady flux of mutations, Genetics 61 (1969) 893 | the expected site-frequency spectrum under a steady flux of new mutations |
| J. F. C. Kingman, The coalescent, Stochastic Process. Appl. 13 (1982) 235 | the standard model of ancestry, with lines merging two at a time |
| S. A. Sawyer and D. L. Hartl, Population genetics of polymorphism and divergence, Genetics 132 (1992) 1161 | the Poisson random field: the formula for the selected spectrum that every fit evaluates |
| W. Gautschi, Computational aspects of three-term recurrence relations, SIAM Rev. 9 (1967) 24 | why a recurrence run at fixed precision loses its small solution to the large one |
| P. Tataru, M. Mollion, S. Glémin and T. Bataillon, Inference of distribution of fitness effects and proportion of adaptive substitutions from polymorphism data, Genetics 207 (2017) 1103 | polyDFE, the first of the three standard programs compared with the exact values |
| B. Y. Kim, C. D. Huber and K. E. Lohmueller, Inference of the distribution of selection coefficients for new nonsynonymous mutations using large samples, Genetics 206 (2017) 345 | fitdadi, with the 2017 rule for DFE mass beyond its selection grid |
| J. Sendrowski and T. Bataillon, fastDFE: fast and flexible inference of the distribution of fitness effects, Mol. Biol. Evol. 41 (2024) msae070 | fastDFE, the third program compared with the exact values |
| S. Chen et al. (Genome Aggregation Database Consortium), A genomic mutational constraint map using variation in 76,156 human genomes, Nature 625 (2024) 92 | the gnomAD database, whose v4.1 exome release the first paper fits |
| S. Myers, C. Fefferman and N. Patterson, Can one learn history from the allelic spectrum?, Theor. Popul. Biol. 73 (2008) 342 | proof that different population histories can give identical neutral spectra |
| E. F. Fenton, D. P. Rice, J. Novembre and M. M. Desai, Detecting deviations from Kingman coalescence using 2-site frequency spectra, Genetics 229 (2025) iyaf023 | the two-site test for multiple mergers, and its rejection of Kingman ancestry in fruit flies |
| M. Byrska-Bishop et al., High-coverage whole-genome sequencing of the expanded 1000 Genomes Project cohort, Cell 185 (2022) 3426 | the sequence data from which the 113 Gambian and the Yoruba genomes are drawn |
| A. Bergström et al., Insights into human genetic variation and population history from 929 diverse genomes, Science 367 (2020) eaay5012 | the HGDP callset, the independently processed callset of the replication check |
| G. Palsson et al., Complete human recombination maps, Nature 639 (2025) 700 | the deCODE genetic map used to bin the pairs, and the pedigree tract length of 110 base pairs |