Reproducing published economics (economics)
The content on this page was written by AI under human supervision.
For many years a number of economics journals have required each published article to come with a replication packageThe data and code that an article’s authors deposit with the journal so that others can rerun the calculations behind the published numbers., the data and code behind its numbers. NBER (National Bureau of Economic Research) Working Paper 35782, by Matthew D. Schwartz, Isaiah Andrews, and Jesse M. Shapiro, describes an open-source workflow in which a large language model (LLM) reads such a package and reruns the article’s calculations against the printed numbers. It then looks for faster ways to do them and proposes further results under the article’s own assumptions. Applied to 4,452 packages from five journals, it flags a discrepancy somewhere in the article or appendix in 3,460, speeds a calculation up more than tenfold in 496, and develops an extension in 923. The authors present this as a report of work still under way.
Replication packages
Computationally, an empirical economics article is a chain of steps: data are cleaned and merged, estimators and simulations run on the result, and the output becomes the numbers printed in the tables. In the usage of the National Academies’ 2019 report on the subject, which the paper cites, reproducibility means that the same data and code return the published numbers, and replicability means that a new study with its own data reaches a consistent conclusion. This paper is about the first.
The paper’s earliest reference on the practice of depositing data and code is the Journal of Money, Credit and Banking replication project that Dewald, Thursby, and Anderson reported in 1986. The paper’s first figure marks the first full calendar year in which each of its five journals required authors of accepted articles to submit data and code: 2005 for the American Economic Review, following Bernanke’s 2004 editorial statement; 2005 for Econometrica; 2006 for the Journal of Political Economy and the Review of Economic Studies; and 2017 for the Quarterly Journal of Economics.
To check a deposited package, someone has to install the software the authors used, which may require a license, and obtain the data, some of which may be confidential and absent from the deposit. Then every script has to be run and its output compared with the printed tables. The paper cites eight earlier large-scale studies of reproducibility and of replicability, from McCullough, McGeary, and Harrison in 2008 to Brodeur and coauthors in Nature in 2026, and notes that they consider dozens or hundreds of articles; this one considers 4,452. The paper also cites three efforts from 2025 and 2026 to have LLMs assess or carry out reproductions. A fourth, Muravyev (2026), reconstructs the main result of 1,328 finance articles from source databases rather than from packages.
The LLM workflow
The authors start from the hypothesis that a modern LLM combines the skills of a software engineer with broad knowledge of mathematics, computer science, and other sciences, a mix few if any people hold at once. It might therefore see ways to improve a piece of research that a human reader, even a domain expert, could miss. The test bed is every available replication package for articles published from 2000 through 2026 in the five journals named above, the five highest-ranked general-interest peer-reviewed economics journals according to the RePEc (Research Papers in Economics) rankings. Each package comes with its published article and any online appendix, treated together as “the article.”
Before any article is checked, a multi-agent LLM workflow builds an open-source library that lets the model reproduce the kinds of computation found across the corpus. Rendering a package’s calculations in open-source form makes their internals visible to the LLM, so that it can understand and later improve them. The workflow proper is built on that library and has four tasks: check reproducibility, analyze sensitivity, improve computations, and extend results.
Reproduction begins with the package’s documentation. The workflow reads it to learn which calculations, if any, are declared not reproducible because their data are omitted, for example because they are confidential; the paper calls these data-gatedThe paper’s term for a calculation that cannot be rerun because its data are omitted from the package, for example because they are confidential.. If every calculation is so declared, no reproduction is attempted; the workflow instead compares the package’s code and any log files with the text and records each apparent discrepancy, which it cannot verify. Otherwise it attempts every other calculation, working from the open-source library, the package’s own code, and the article’s description of its methods. Two things count as a discrepancy: a calculation blocked by a data omission the documentation did not declare, and a calculation that runs but returns a value different from the published one.
Every recorded discrepancy then goes through two quality-control steps. The first is a second pass by another LLM agent whose assigned goal is to overturn the discrepancy and uphold the reproducibility of the original finding. The second applies wherever the authors could enable licensed access to the original software in which the code was written: the calculation is rerun there. For a discrepancy that survives both, the workflow also records the change to the article’s text that would align it with the recomputed value.
Reproduction and sensitivity
The paper’s Figure 2, below, traces the 4,452 packages through each branch of the reproduction procedure. In 87.6% of packages a reproduction is attempted, and among those the workflow flags, and verifies, a discrepancy in 87.3%. In 6.3% of the packages with a discrepancy, the earliest one is a data omission rather than a mismatched value. As shares of all packages, 11.2% reproduce fully at the precision the article reports and 76.4% do not. The other 12.4% declared everything dependent on omitted data, so only an apparent discrepancy in code or logs can be recorded. In all, counting those apparent discrepancies in code or logs, the workflow flags a discrepancy in 3,460 articles or their appendices.
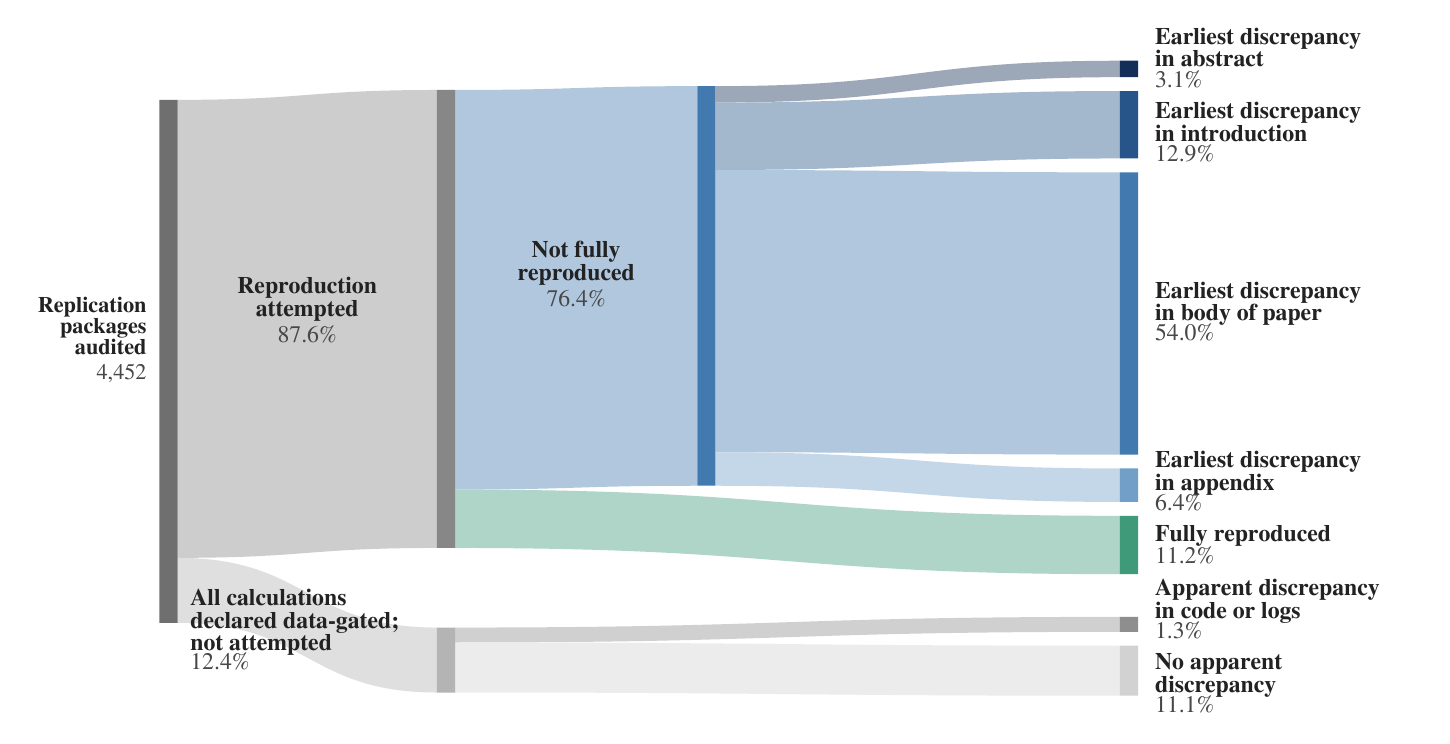
Outcomes of the reproducibility audit across five economics journals. The diagram flows left to right and branches at each step of the reproduction procedure; band widths are proportional to the number of packages, with a minimum width so that small categories stay visible. The first branch is whether a package’s documentation declares every original calculation dependent on omitted data (lower gray band, 12.4%: no reproduction attempted, and an apparent discrepancy in code or logs in 1.3%) or not (87.6%: every other calculation attempted). Attempted packages are either fully reproduced at article-reported precision (green, 11.2%) or cataloged by the location of their earliest calculation discrepancy (or, if none, their earliest data omission): abstract 3.1%, introduction 12.9%, body 54.0%, appendix 6.4%. All percentages are shares of the 4,452 audited packages. In most packages where a reproduction could be attempted, at least one recomputed value or undeclared data omission occurs somewhere between the abstract and the end of the appendix, most often in the body of the paper. (Figure 2 of the paper.)
Many of the discrepancies are small. The paper’s Figure 3 shows the 3,166 articles whose earliest discrepancy is a number recomputed at a different value, binned by the size of the difference measured in the digits of the published value. The mildest category contains articles whose recomputed value $\hat{v}$ and published value $v$ satisfy
$$\lvert \hat{v} - v \rvert \;\le\; 1.0\,u(v), \qquad u(v) = \text{one unit in the last printed digit of } v .$$(The symbols are this page’s shorthand; the paper states the criterion in words.) If an article prints 0.047, then $u(v)$ is 0.001, and a recomputed value of 0.046 or 0.048, off by one unit in the last printed digit, falls in this bin, which the paper describes as consistent with rounding or truncation. The bin holds 35.6% of the 3,166 articles. The others are placed by the earliest significant digitThe meaningful digits of a printed number, counted from its first nonzero digit; a difference at the first significant digit changes the leading figure itself. of the published value at which the recomputed value, rounded to the published precision, differs: 3.9% only beyond the third, 10.5% at the third, 25.1% at the second, and 24.9% at or before the first.
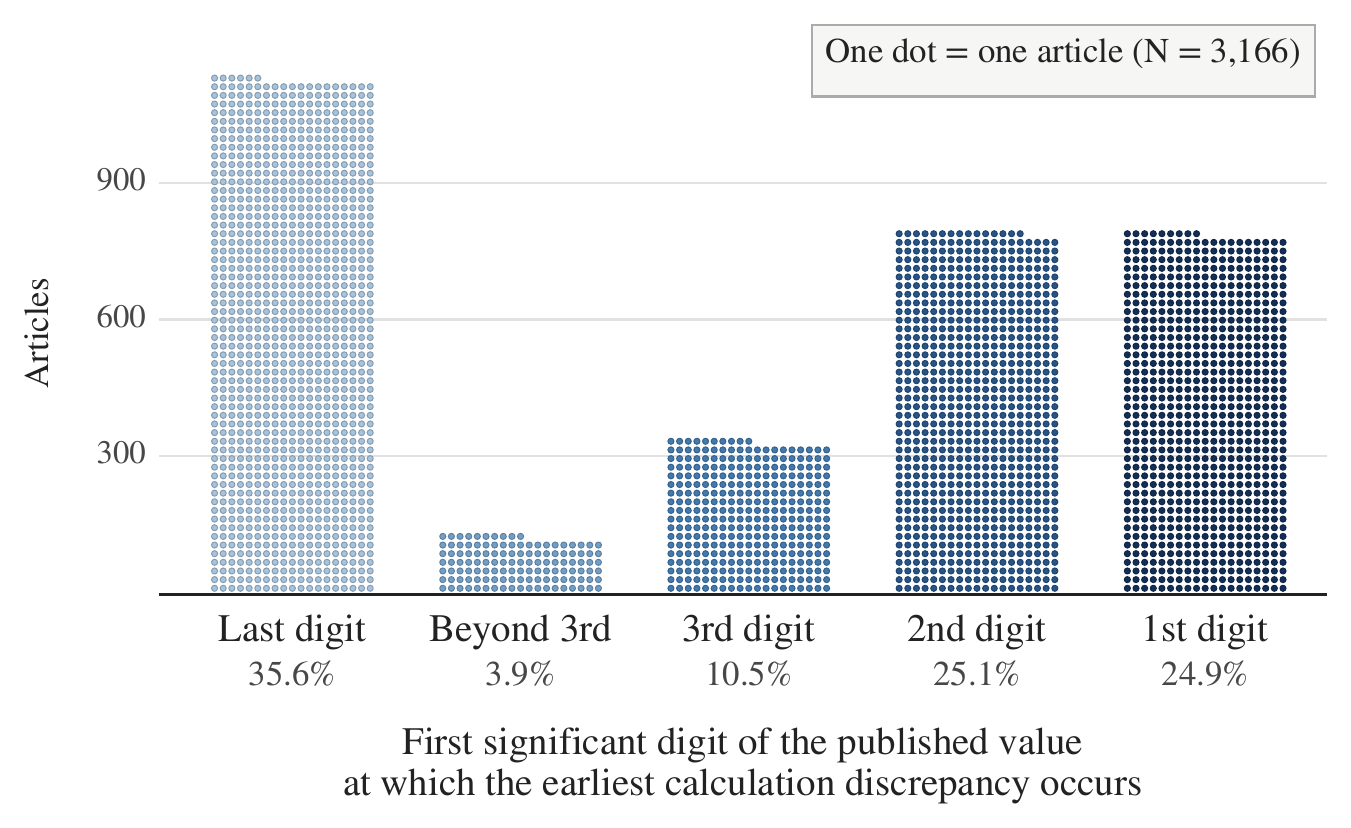
The significant digit of each article’s earliest calculation discrepancy. Each dot is one article whose earliest discrepancy is a calculation recomputed at a value different from the published one; an article appears at most once, and articles whose earliest discrepancy is a quantity not printed as a number, such as a range, are excluded, leaving 3,166. “Last digit” contains articles whose recomputed value agrees with the published value to within 1.0 units of the last printed digit; the other columns place articles by the earliest significant digit of the published value at which the recomputed value, rounded to the published precision, differs, from “beyond 3rd” through “1st digit” (at or before the first). About a third of the earliest discrepancies are of rounding size, and about a quarter reach the leading digit. (Figure 3 of the paper.)
A reproduced estimate can also be tested for how much it depends on a few data points. Giordano, Meager, and Broderick (2026) proposed checking published findings for sensitivity to removing small amounts of data and demonstrated the idea on nine articles; the paper applies it to 1,908. The method rests on a standard first-order approximation. For a point estimateA single reported number estimating some quantity, such as a regression coefficient or an average effect, as opposed to a range or an interval. $\hat{\theta}$ computed from $n$ units that the article’s own inferential method treats as independent, rows of a data table or clusters of rows, deleting unit $i$ changes the estimate to approximately
$$\hat{\theta}_{-i} \;\approx\; \hat{\theta} \;-\; \frac{1}{n}\,\psi_i ,$$where $\hat{\theta}_{-i}$ is the estimate with unit $i$ removed and $\psi_i$ is the empirical influence of unit $i$. (The display is the general form; the paper states it in words.) The workflow uses it only to rank: it picks the 5 units of greatest approximate influence, removes them one at a time, and recomputes the original estimate each time. The change is reported as an absolute percentage of the workflow’s own reproduction of the published value,
$$\Delta \;=\; 100 \times \frac{\lvert \tilde{\theta} - \hat{\theta} \rvert}{\lvert \hat{\theta} \rvert} ,$$with $\hat{\theta}$ the reproduced value and $\tilde{\theta}$ the value after the change, again in this page’s shorthand for a rule the paper states in words; each article is classified by its largest $\Delta$. A $\Delta$ above 100 means the estimate more than doubled or changed sign. Removing a single unit does that to some reported point estimate in 963 of the 1,908 articles, and in 512 of those the published value is printed to at least two significant digits.
Improving the computations
The improvement step screens for calculations that involve numerical optimization, integration, simulation, or another approximate numerical method; 1,781 articles have at least one that the workflow could reproduce, and each of these gets two kinds of attempt. A reimplementationThe paper’s term for speeding up a calculation without changing its algorithm, for example by vectorizing or removing overhead; the output must match the original to floating-point rounding. keeps the algorithm and speeds up the code, by profiling it and applying standard practice such as cutting overhead or vectorizing. It must match the original output to within floating-point rounding, and it is timed against the workflow’s open-source rendering of the original code on the same machine. A reformulation changes the algorithm itself, for instance by using an exact characterization of the solution known from other research or another discipline but not used in the package. Because a reformulation may genuinely improve on the original, an exact match is not always possible or desirable. Reformulations are therefore tested for fidelity to the mathematical intent of the calculation, for example against a high-precision computation or a smaller instance of the same problem.
Figure 5 of the paper, below, bins each article by the largest speedup any of its calculations received: running time before divided by running time after. Reimplementations speed something up in 1,535 articles, by more than a factor of 10 in 252. Reformulations help in 1,324 and exceed a factor of 10 in 308, often with greater accuracy as well. In the reformulation panel the speedup is measured against the already reimplemented code, so the two panels do not count the same gain twice. Counting both, computation time falls by more than a factor of 10 in 496 of the 1,781 articles.
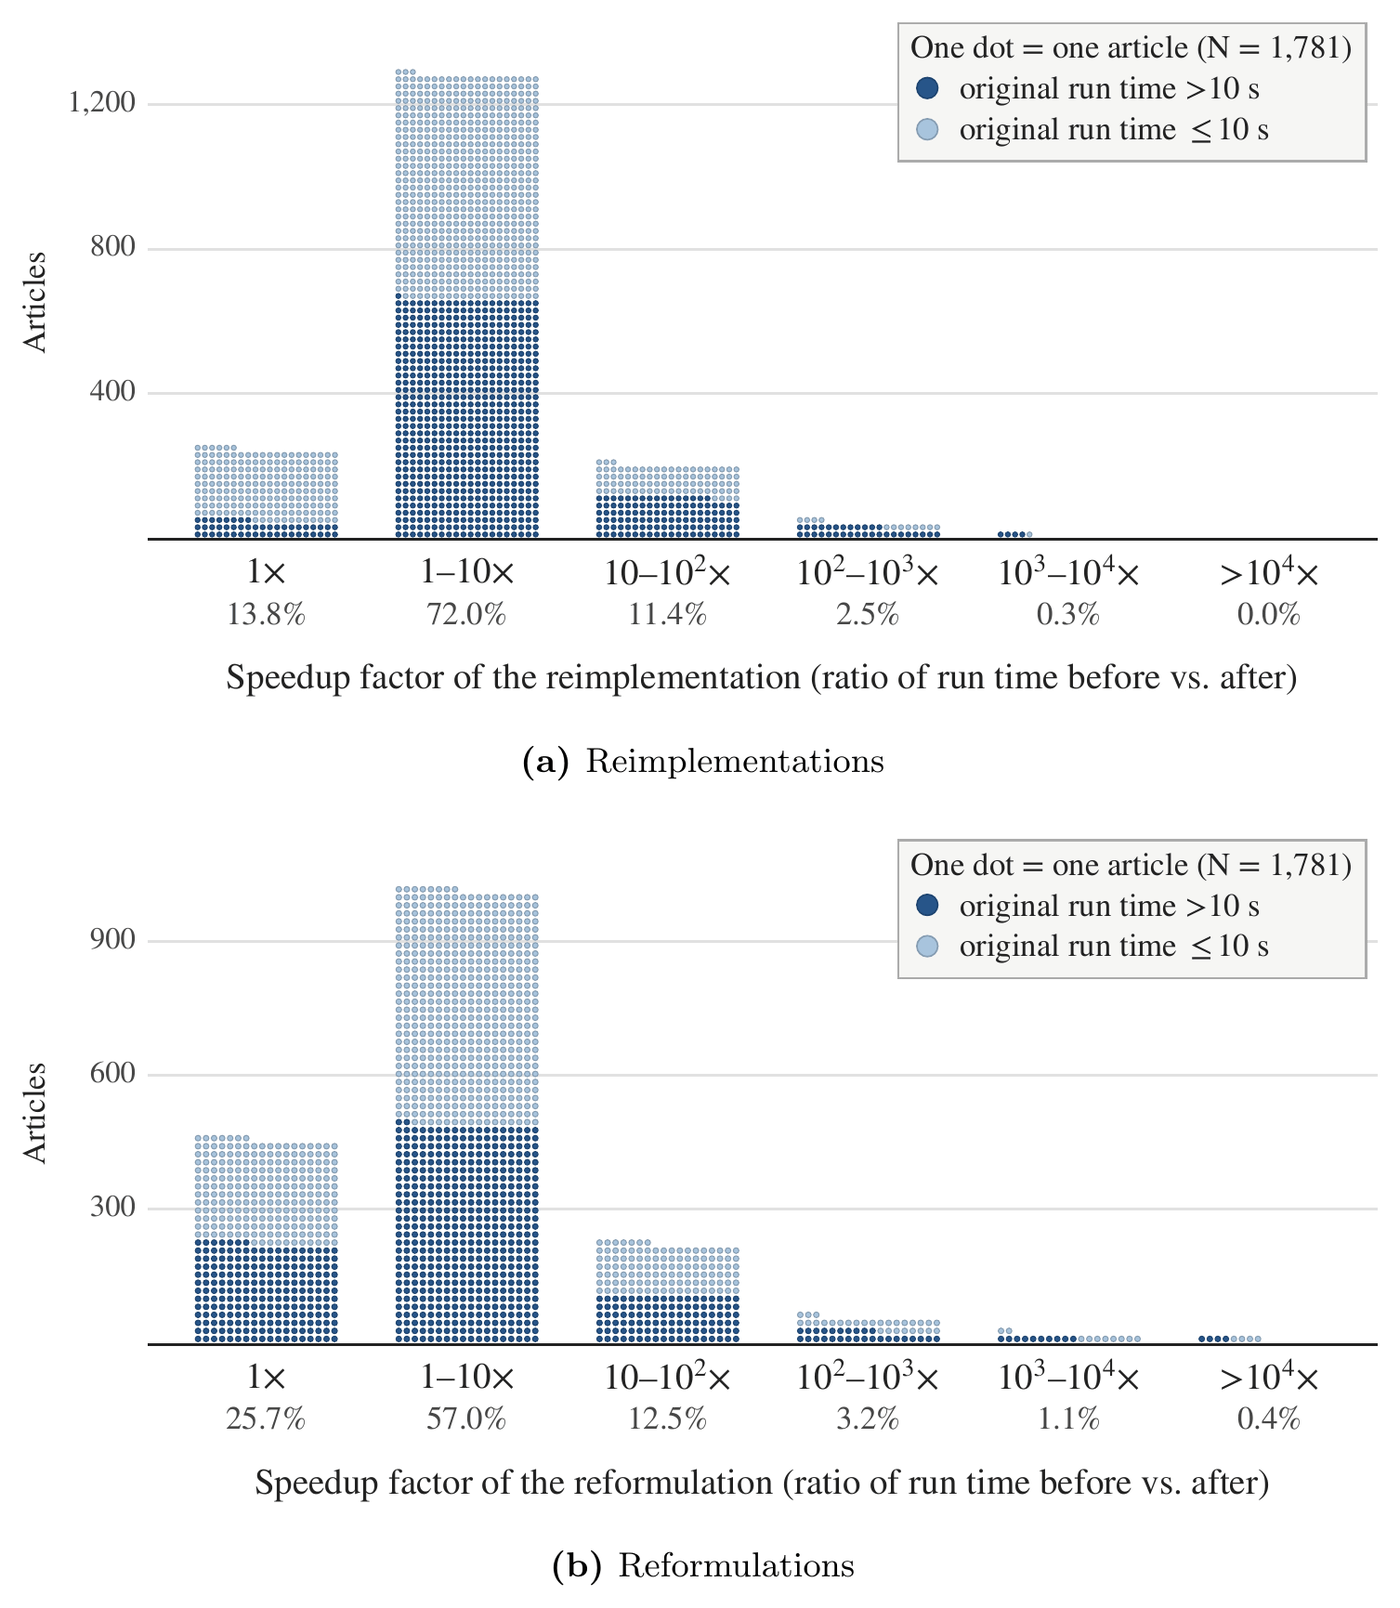
Speedup of reported calculations under the improvement step. Each dot is one article, placed once in each panel by the largest speedup factor among its improved calculations, running time before divided by running time after, in decade-wide bins. Panel (a) shows reimplementations (same algorithm, faster code), timed against an open-source rendering of the original code; panel (b) shows reformulations (a different algorithm), timed against the already reimplemented code, so gains are not counted twice. Dark dots mark articles whose original calculation took more than ten seconds. The 1,781 articles are those with at least one reproducible calculation involving numerical optimization, integration, simulation, or another approximate method; percentages are of each panel’s total. Most gains are under tenfold, but a tail of articles runs hundreds to tens of thousands of times faster, more often by reformulation than by reimplementation. (Figure 5 of the paper.)
The paper gives one example of a reimplementation and one of a reformulation, both from the Review of Economic Studies. Lee (2026) has a package the workflow reproduces exactly, at every printed digit, for every calculation it can run. Its bootstrap confidence intervals come from 1,000 replications, each built from its own random draws and processed one at a time in a loop. The workflow notices that each replication enters the intervals only through means of quantities that do not vary across replications, so all of them can be computed at once as one matrix product. Replaying the original seeded random draws, the new code returns the published intervals exactly, roughly 440 times faster. Akcigit, Pearce, and Prato (2025) calibrate seven model parameters to seven data moments by minimizing a numerical objective with a stochastic search followed by a local solver. The workflow observes that the minimizing parameters can be found in closed form, with no numerical optimization, and uses interval arithmetic to establish that this solution is the only root in its neighborhood. The closed form matches every printed digit of the published calibration and evaluates roughly 24,000 times faster than the workflow’s rendering of the original solver.
Extending the results
In the last step the workflow asks whether the article could have said more with what it already had: for each of the article’s quantitative conclusions, whether existing mathematical or scientific knowledge would allow a further result without different or additional substantive assumptions, statistical or economic. Two checks by opposing LLM agents follow. One probes for unstated assumptions that the extension needs and the original analysis did not; only extensions that need none are registered. The other argues that the extension is of no use to the article’s readers, and here, the paper says, the workflow makes a subjective judgment about which extensions to keep.
Of 4,418 articles screened, the workflow proposes an extension in 923. When each article is counted once, by the extension relevant to its earliest section, 143 add a new counterfactual or other substantive calculation, 367 quantify uncertainty for a quantity the article left without it, and the rest add sensitivity analysis. For the other 3,495 articles nothing is proposed.
The paper gives one example of a new counterfactual and one of an added measure of uncertainty. Kaas, Lalé, and Siassi (2026), in Econometrica, use an overlapping-generations macroeconomic model with a job ladder to simulate a 10 percent cut in unemployment-insurance benefits in Germany. The workflow solves the same general-equilibrium system, to the article’s own convergence tolerances, for a 25 percent cut, and finds that most reported outcomes scale less than proportionately with the size of the cut. Carrera and coauthors (2022), in the Review of Economic Studies, estimate from a structural model that participants who take up a commitment contract for gym attendance incur a welfare loss equivalent to $18.69 per person. The article gives no measure of that number’s uncertainty. The workflow applies a bootstrap analogous to one used elsewhere in the same article and obtains a 95% confidence interval from $12.75 to $23.99.
Evaluation and caveats
The authors say twice that the workflow does not aim to evaluate research. They do report a separate experiment on LLM evaluation, with the emphasis on how stable such judgments are. Agents of two models, Claude Opus 5 and Claude Fable 5.1, read 100 articles selected from the corpus, stratified by the number of values in the article body for which the reproduction yields a value and a standard error. The agents were given the article alone, the article with its package, or both plus the workflow’s reproduction. Ten fresh agents per model and condition rated each article’s conclusions and implementation. Access to the reproduction led both models to rate more articles as correct. Given the reproduction, they rated the findings as reproduced with minor differences in 83.1% and 83.6% of readings. Three sessions of one model, drawn at random from its ten, are expected to give the same reproduction rating for 88.6% and 89.1% of articles.
The authors describe the paper as a report of methods and findings to date: values are current as of this release, work is ongoing, and improvements learned from individual cases propagate across the corpus. Computing is largely complete for values printed in articles and less so for appendices. Apparent discrepancies in packages whose data are entirely omitted cannot be verified, and reruns in the original software were possible only where licensed access could be arranged. The document is an NBER working paper, circulated for discussion and comment and not peer-reviewed.
The paper
- An LLM Workflow That Reproduces, Improves, and Extends Published Economics Research (NBER Working Paper 35782, on the NBER site) — Matthew D. Schwartz (Harvard University), Isaiah Andrews (MIT and NBER), and Jesse M. Shapiro (Harvard University and NBER); September 2026, JEL C80. The paper describes the reproduction library and the four tasks of the workflow, and reports, as findings to date, the reproduction, sensitivity, improvement, and extension results for the 4,452 packages from the five journals, together with the separate experiment on LLM evaluation; the replication packages, articles, and appendices were downloaded from the journals’ websites and official repositories. The authors disclose in the paper that LLMs were used in its analysis and writing, and that for this project Schwartz worked as a contractor for Anthropic, which does not endorse the results or views; the NBER cover page also states that at least one coauthor has disclosed additional relationships of potential relevance, with further information at nber.org/papers/w35782.
Supplementary material
The paper describes the reproduction library and the workflow as open source.
- github.com/MetaEconomics — the MetaEconomics organization on GitHub, the location for updates and public releases of project materials, including the workflow when it is released.
References
| National Academies of Sciences, Engineering, and Medicine, Reproducibility and Replicability in Science, National Academies Press, Washington, DC (2019) | cited on reproducibility as part of the scientific process; its usage separates reproducibility from replicability |
| W. G. Dewald, J. G. Thursby and R. G. Anderson, Replication in empirical economics: The Journal of Money, Credit and Banking project, Am. Econ. Rev. 76 (1986) 587 | the early journal replication project; the paper’s first reference on depositing data and code |
| B. S. Bernanke, Editorial statement, Am. Econ. Rev. 94 (2004) 404 | announced the American Economic Review requirement to submit data and code |
| B. D. McCullough, K. A. McGeary and T. D. Harrison, Do economics journal archives promote replicable research?, Can. J. Econ. 41 (2008) 1406 | the earliest of the eight large-scale reproducibility and replicability studies cited |
| A. Brodeur, D. Mikola, N. Cook et al., Reproducibility and robustness of economics and political science research, Nature 652 (2026) 151 | the most recent of those eight studies |
| A. Brodeur, D. Valenta, A. Marcoci et al., Comparing human-only, AI-assisted, and AI-led teams on assessing research reproducibility in quantitative social science, IZA Discussion Paper 17645, IZA Institute of Labor Economics (2025) | the first of three cited studies of LLMs assessing or carrying out social-science reproductions |
| C. Hu, L. Zhang, Y. Lim, A. Wadhwani, A. Peters and D. Kang, REPRO-bench: Can agentic AI systems assess the reproducibility of social science research?, in Findings of the Association for Computational Linguistics: ACL 2025 (2025) 23616 | the second of those three studies |
| B. Kohler, D. Zollikofer, J. Einsiedler, A. Hoyle and E. Ash, Read the paper, write the code: Agentic reproduction of social-science results, arXiv:2604.21965 (2026) | the third of those three studies |
| D. Muravyev, Does empirical finance replicate?, working paper, University of Illinois Urbana-Champaign (2026) | an LLM reconstruction of 1,328 finance results from source databases rather than packages |
| R. Giordano, R. Meager and T. Broderick, An automatic finite-sample robustness metric: When can dropping a little data change conclusions? Part I: definitions and experiments and Part II: theory and intuition, Phil. Trans. R. Soc. A 384 (2026) 20250001 and 20240614 | the dropping-data sensitivity check, demonstrated on nine articles and applied here to 1,908 |
| W. Lee, Identification and estimation of dynamic random coefficient models, Rev. Econ. Stud. (2026) | the reimplementation example: a bootstrap loop as one matrix product, about 440 times faster |
| U. Akcigit, J. Pearce and M. Prato, Tapping into talent: Coupling education and innovation policies for economic growth, Rev. Econ. Stud. 92 (2025) 696 | the reformulation example: a closed-form calibration, about 24,000 times faster |
| L. Kaas, E. Lalé and N. Siassi, Job ladder and wealth dynamics in general equilibrium, Econometrica 94 (2026) 1449 | the extension example with a new 25 percent benefit-cut counterfactual |
| M. Carrera, H. Royer, M. Stehr, J. Sydnor and D. Taubinsky, Who chooses commitment? Evidence and welfare implications, Rev. Econ. Stud. 89 (2022) 1205 | the extension example that adds a confidence interval to a welfare estimate |