Adaptive trial designs (medicine)
A Phase II trial design is judged by how often it would approve an ineffective drug and how often it would miss an effective one. For adaptive and Bayesian designs these numbers are usually estimated from a few thousand simulated trials, and in nine published designs about a third of the reported values lie within simulation noise of the threshold they have to clear. Most can be computed exactly instead, and when the close calls are recomputed about a quarter of them land on the other side of their threshold.
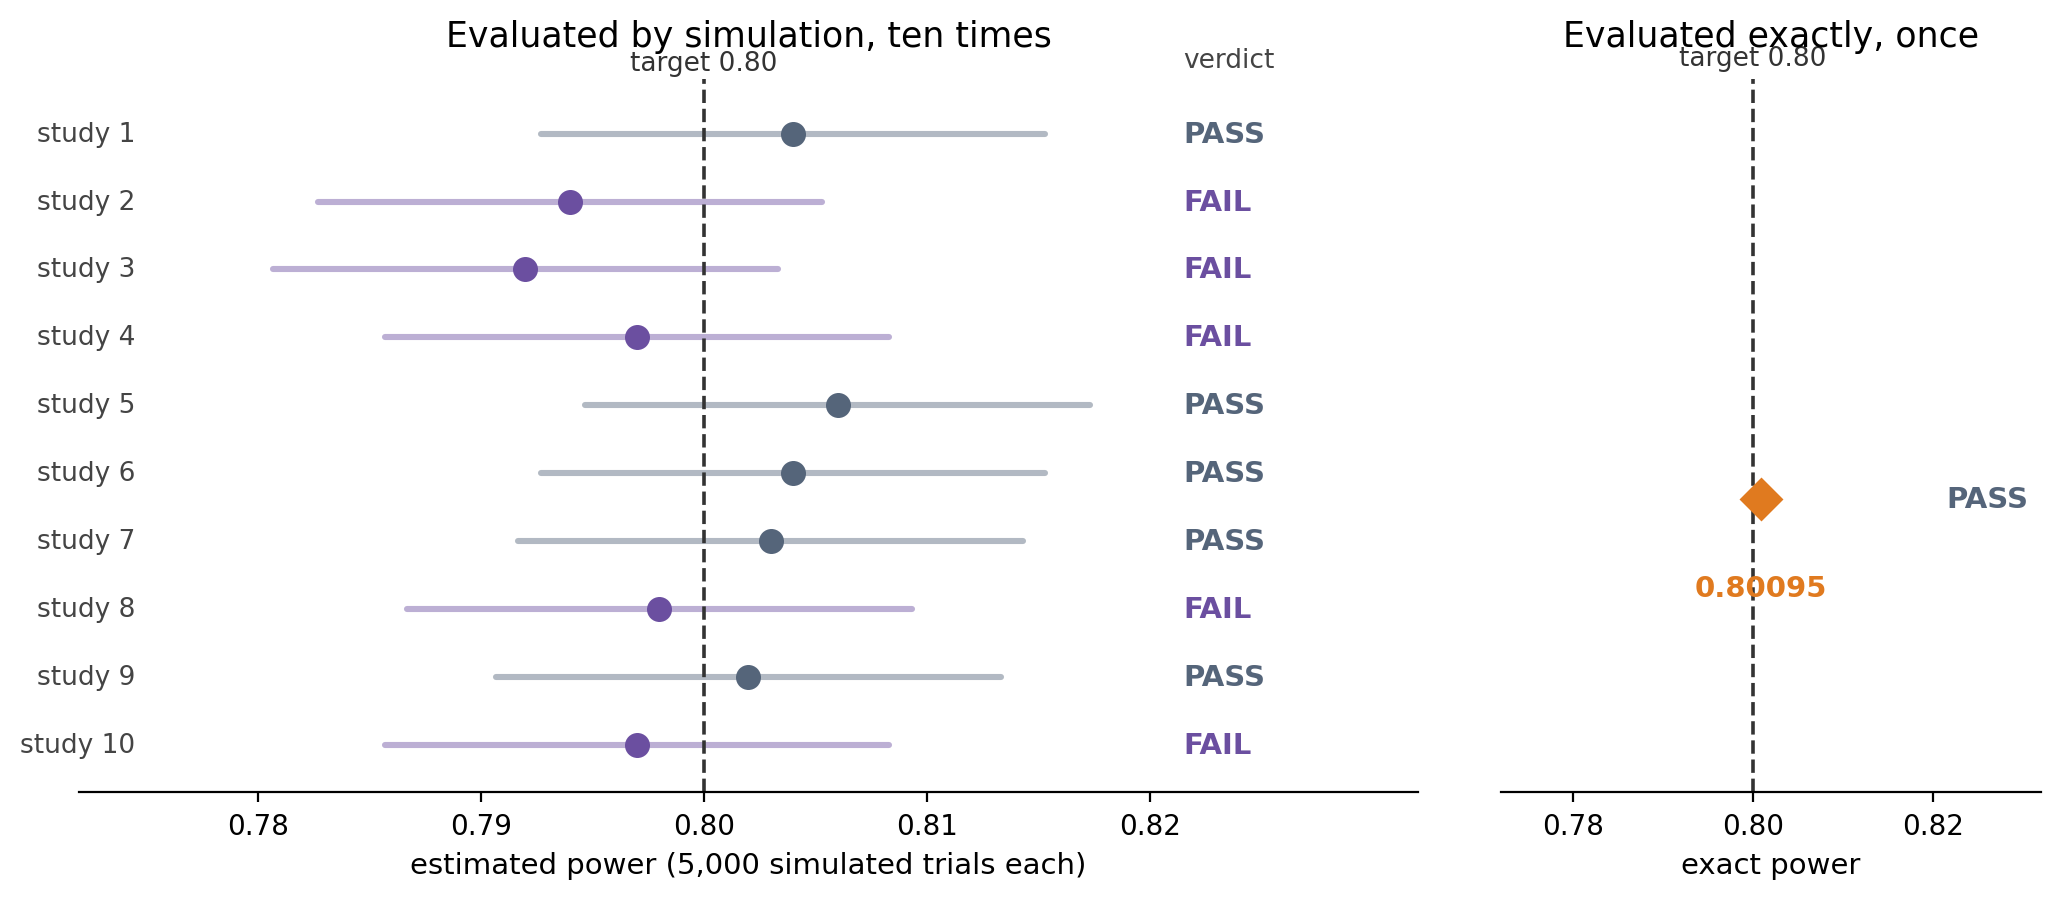
One trial design, two ways of checking whether it reaches 80% power. Left: the ten simulation estimates printed for this design in a published paper, each from 5,000 simulated trials (bars: two Monte Carlo standard errors). Five say the design fails its target and five say it passes. Right: the exact calculation gives one number, 0.80095, and one verdict. The design is the Simon two-stage comparator discussed under “Recomputing the close calls” below.
Judging a trial before it runs
A Phase II trial decides whether a new treatment proceeds to a large confirmatory triala large Phase III trial designed to establish that a treatment works; the usual basis for approval. Its design (the sample sizes, the interim looks, and the rule for declaring the treatment promising) is judged in advance on two probabilities. The type I error ratethe probability that the trial declares an ineffective treatment promising; the design’s false-alarm rate, which a design paper promises to keep under a nominal level such as 5 or 10 percent is the probability that the design carries forward a treatment that does not work, and the power is the probability that it carries forward one that does; together they are the design’s operating characteristics. A design paper states the conclusion these two numbers support, for example that the type I error rate is controlled at ten percent or that the power reaches eighty percent, and sponsors and regulators rely on that conclusion.
The classic template is the two-stage design Richard Simon published in 1989. Each patient either responds or does not. The design is four integers $(r_1, n_1, r, n)$: enroll $n_1$ patients and stop for futilitystopping early because the responses seen so far make a final positive result unlikely if $r_1$ or fewer respond; otherwise continue to $n$ patients in all and declare the treatment promising if more than $r$ respond. If the true response rate is $p$, the probability of that declaration is
$$R(p) \;=\; \sum_{x_1 = r_1 + 1}^{n_1} \binom{n_1}{x_1} p^{x_1} (1-p)^{n_1 - x_1} \sum_{x_2 = \max(0,\, r+1-x_1)}^{n - n_1} \binom{n - n_1}{x_2} p^{x_2} (1-p)^{n - n_1 - x_2}.$$Here $x_1$ counts responses among the first $n_1$ patients and $x_2$ those among the rest; each binomial factor is the probability of exactly that many responses, and the limits of the sums encode the two rules. The type I error rate is $R(p_0)$ and the power $R(p_1)$, with $p_0$ the response rate of a useless drug and $p_1 \gt p_0$ that of a useful one. Both are finite sums, exact fractions whenever $p$ is, and optimal designs of this kind are found by evaluating them exactly.
Later adaptive designs add more interim looksplanned points during enrollment at which the accumulated responses are examined and the trial may stop and more elaborate stopping rules. Bayesian designs act on posterior probabilitiesthe probability, computed by Bayes’ rule from a prior and the responses seen so far, that the drug’s true response rate lies below (or above) some value; the quantity a Bayesian stopping rule compares with a cutoff; the design BOP2 of Zhou, Lee and Yuan (2017), for example, stops for futility when the posterior probability that the treatment is ineffective exceeds a cutoff that depends on the enrollment so far. Basket designsone therapy tested in several patient subgroups (“baskets”) at once, with a hierarchical model that lets the subgroups borrow evidence from one another through a shared prior on their response rates test one therapy in several subgroups at once and let them borrow evidence through a shared prior. Cutoffs in such designs are usually calibrated, that is, tuned until the type I error rate is as close to the nominal levelthe error rate a design promises not to exceed, such as 5 or 10 percent as possible without exceeding it.
Simulation tables and their Monte Carlo error
For adaptive and Bayesian designs the standard evidence is a simulation table. Whoever proposes a design codes it, runs it a few thousand times under a scenario in which the drug does nothing and again under scenarios in which it works, and reports the fraction of runs that declared the treatment promising. Simulation became the standard because the number of ways a multi-arm, multi-look trial can come out grows exponentially while the cost of one simulated trial does not. Each entry is then a Monte Carlo estimate whose uncertainty is fixed by two printed numbers, the estimate $\hat p$ and the number of simulated trials $n$. Its standard error, as Morris, White and Crowther (2019) give it, and the number of runs that would place it two standard errors from a threshold $b$, are
$$\mathrm{MCSE} \;=\; \sqrt{\hat p\,(1-\hat p)/n}\,, \qquad\qquad n \;\gtrsim\; \frac{4\,\hat p\,(1-\hat p)}{(\hat p - b)^2}\,.$$A type I error rate reported as 0.100 from 1,000 simulated trials has a Monte Carlo standard error (MCSE) of about 0.0095. At two standard errors it is compatible with a true rate 1.9 percentage points above or below a 10 percent threshold, so a rerun with a different random seedthe number that starts a program’s random-number generator; a different seed gives a different, equally valid set of simulated trials could land on the other side. The required $n$ grows as the inverse square of the margin, so halving the distance to the threshold quadruples it. Both formulas can be evaluated from a published table alone, without further simulation.
Regulatory guidance already discusses the precision of simulated operating characteristics. The FDA’s 2019 guidance on adaptive designs illustrates that precision with 100,000 simulated trials per scenario and allows fewer when the estimate’s whole confidence interval lies below the desired level; the draft international guideline ICH E20 gives the same 100,000 as an example, and both ask that the count be reported with a justification. That 100,000 is best read as an example of sufficient precision rather than as a required count.
Exact computation instead of simulation
It has long been known that for a large class of these designs no simulation is needed. Any design whose decision rule depends only on a finite path of integer counts (so many responses among so many patients at each look, in each arm) has operating characteristics of the same form as Simon’s:
$$\mathrm{OC}(p) \;=\; \sum_{\text{outcome paths } x} \Pr_p[\,x\,]\; \mathbf{1}\bigl[\text{the event the characteristic counts occurs on } x\bigr].$$The sum runs over every sequence of outcomes the trial can produce; $\Pr_p[x]$ is the probability of that sequence at true response rate $p$, a product of binomial factors and hence an exact fraction; and the indicator $\mathbf{1}[\cdot]$ is one when the design’s rule ends that sequence in the event being counted, a declaration that the drug works. A Bayesian design changes only the condition inside the indicator. In BOP2, with a Beta priora standard prior distribution for an unknown response rate; after binomial data the posterior is again a Beta distribution, available in closed form, the posterior probability that the treatment is ineffective falls as responses accumulate, so the stopping rule reduces to a table of integer boundaries and the sum is again binomial. Two conditions must hold in practice: the number of terms must be small enough to evaluate, and everything inside the indicator (boundaries, cutoffs, priors and calibration constants) must be stated in full in the paper or its code. In the nine papers examined the second condition often fails, as the recomputation below shows.
These sums are evaluated with the methods of exact multi-loop Feynman-integral computation in physics: dynamic programming with exact rational weights, and quadrature cross-checked by a second schemequadrature is numerical integration, a weighted sum of the integrand at chosen points; here the posterior integrals were computed by one quadrature scheme and checked by an independent one, the two agreeing near the cutoffs to a few parts in a million. For a binary-endpoint design the sum becomes a direct enumeration, or a recursion over the interim looks in exact fractions. For the hierarchical basket designs each term also needs a posterior-tail integral, which in CBHM and BaCIS reduces to nested one- and two-dimensional integrals computed by the cross-checked quadrature. Where a posterior tail falls too close to its cutoff to call, the result is reported as an interval, and an entry is placed above or below its threshold only when the whole interval lies on one side. Each evaluator was checked against an independent exact calculation and, where the design’s authors released code, against that code. Survival-endpoint designsdesigns whose outcome is the time until an event such as death or progression, a continuous quantity, so the possible trial outcomes cannot be listed have no finite outcome space at all. Where no exact method exists and the design authors’ released code is cheap enough to run, that code is instead rerun with as many simulated trials as the entry’s margin requires, up to two million.
Nine papers and 1,076 table entries
A paper qualified for examination if it proposed an adaptive or Bayesian design, released its code, and printed simulated type I error rates or powers beside a threshold given in the paper, at a stated number of simulated trials. Nine designs contribute table entries: BOP2, BLAST, BaCIS, CBHM, adaptr, ASSISTant, BayesCTDesign, Local-MEM and ScuRMST, published 2014–2026. These nine are all the eligible papers the search found. They qualified by publishing enough to be checked, so they support no conclusion about papers that publish less.
The nine papers contain 1,076 table entries with a paper-stated threshold. For each, the distance of the printed value from its threshold is measured in units of the entry’s own Monte Carlo standard error, in exact arithmetic on the printed digits; an entry within two standard errors is undetermined at the number of simulated trials its paper ran, which is in effect the FDA’s interval condition applied at each paper’s own count. Entries that their papers calibrated to sit at the threshold are counted separately, since they lie close to it by construction.
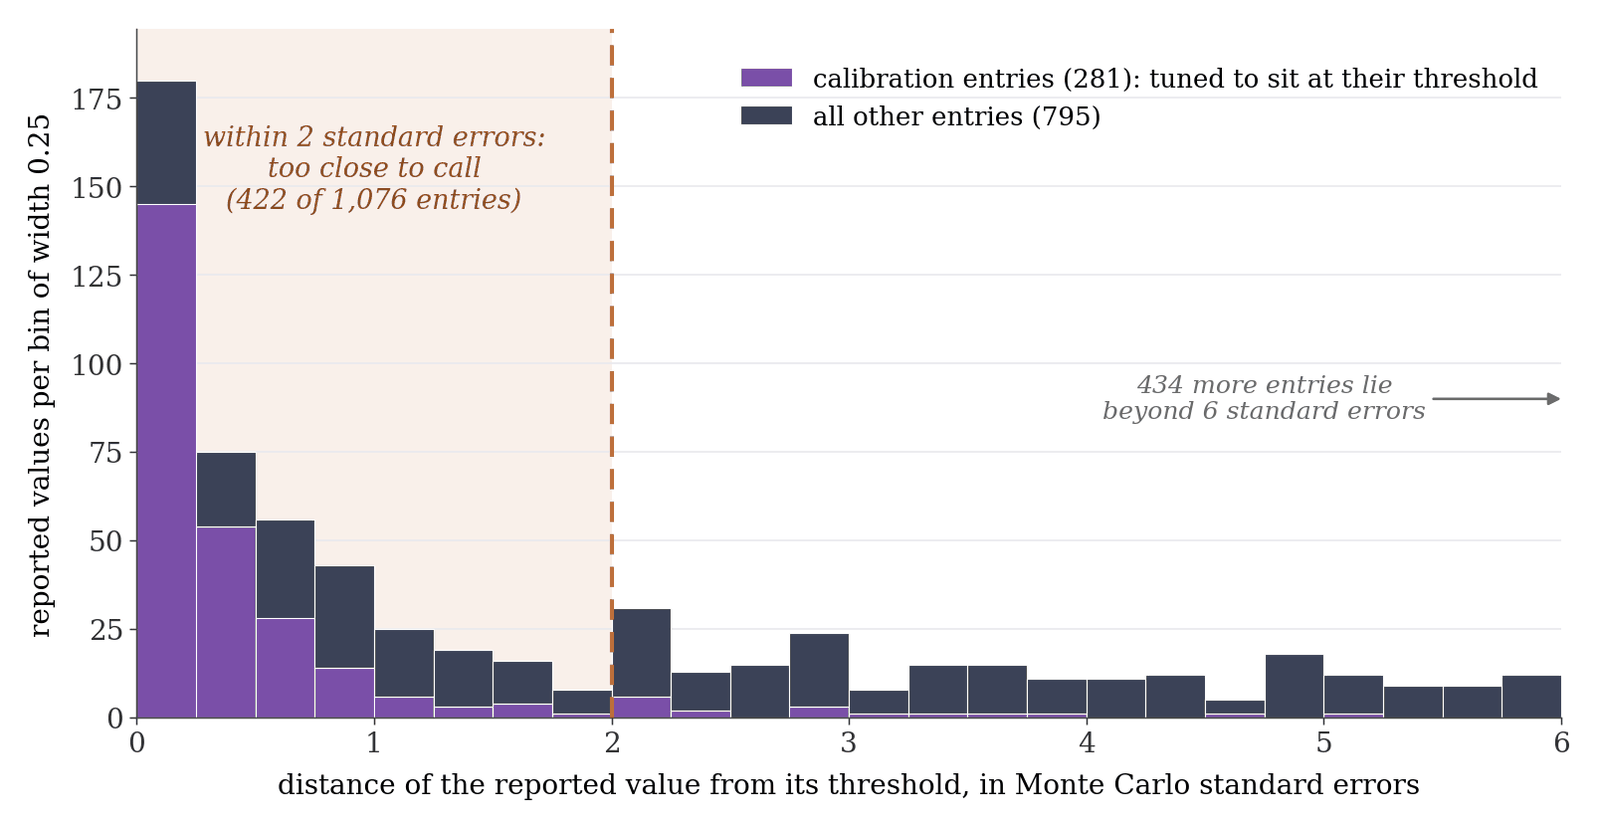
How far each reported value lies from the threshold it is claimed to clear, in units of its own Monte Carlo standard error. Violet: entries calibrated to sit at their threshold. Slate: all others. Everything in the shaded band, within two standard errors, is too close for the reported simulation to say which side the true value is on; the long tail of entries far to the right is in no doubt. (Redrawn from the data of Figure 1 of the paper.)
Setting the calibrated entries aside, about one entry in five still lies within two standard errors of its threshold; counting them, about one reported claim in three is undetermined at its paper’s own number of simulated trials. The second displayed formula gives the number of trials each close entry would have needed: a median of about 46,000, against the 100 to 10,000 that were run, or roughly seventeen times more, entry by entry. Only one scenario in the nine papers was actually simulated at the 100,000 of the guidance example. The extreme case is a type I error rate printed as 0.0498 against a 0.05 threshold from 5,000 trials, which would take 4.7 million. And 77 entries are printed exactly at their threshold; for them no number of simulated trials suffices, and only an exact value can say which side they are on.
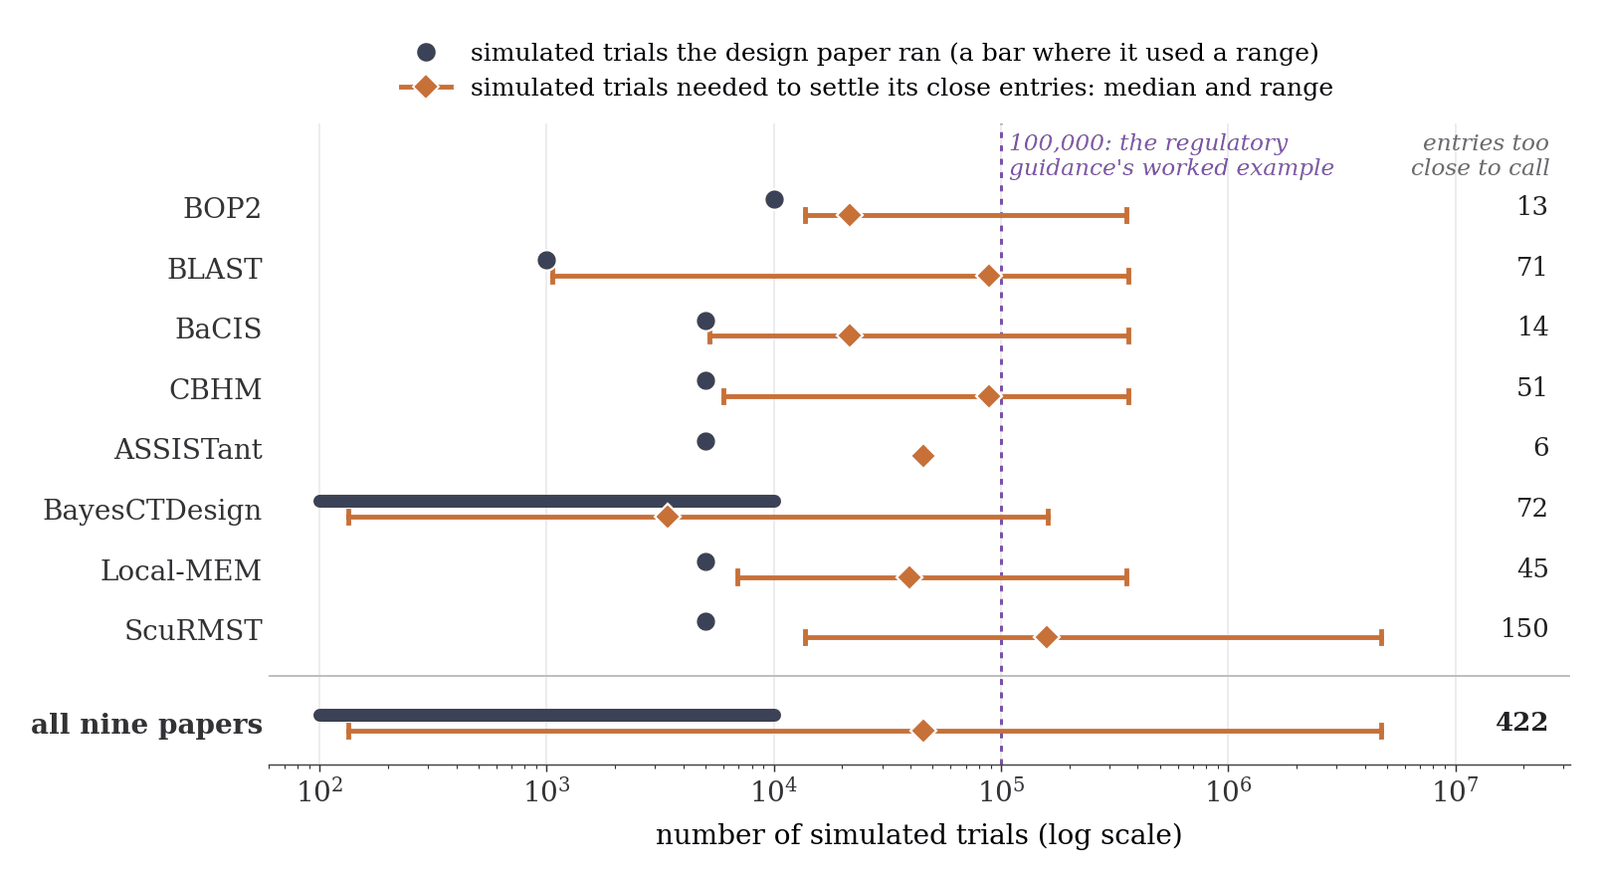
Simulated trials run (slate) against simulated trials needed (orange: median and range over that design’s close entries, count at right), one row per design, on a logarithmic axis. In every design reported at a single count the orange median lies to the right of what was run, and the largest requirement, 4.7 million, is far beyond the 100,000 of the regulatory guidance’s worked example (dotted line). (Drawn from Table 4 of the paper.)
Recomputing the close calls
About three in five of the entries are finite sums or low-dimensional integrals of the kind above, so in principle most of the undetermined ones can be settled exactly. In practice an input is often missing. Of the 351 undetermined entries, 211 cannot be recomputed by any method because a cutoff, critical value or comparator rule appears neither in the paper nor in its released code; one design’s unarchived critical values account for 150 of those, and a later release of any missing input would make its entries computable. Where the published materials were complete, 126 entries were decided, about half of them exactly and the rest by rerunning the authors’ code with enough simulated trials: 87 confirm the reported side, 30 fall on the other side (the reversals), and 9 printed exactly at their threshold receive a side for the first time. Every reversal lies within ordinary Monte Carlo noise of the printed value, and reversals occur about as often as noise alone predicts, so none of them is an error by the paper concerned and none calls a design or an approval into question.
Three recomputations serve as worked examples. The first concerns a Simon two-stage design used as a comparator in Local-MEM’s Table 3. Its power, by the first equation on this page, is a single fraction, 0.800947…, above 0.80 by construction because the design was selected to have power at least 0.80. The Local-MEM paper reports it in ten entries as 0.792 to 0.806 from 5,000 simulated trials, where the standard error is about 0.006. The five entries below 0.80 are ordinary Monte Carlo draws of a quantity whose exact value is 0.80095, and each is a reversal.
The second concerns the calibration scenario of the basket design CBHM, whose code is distributed with calibrated cutoffs. Its table reports type I error rates of 0.098 to 0.100 in four subgroups from 5,000 trials, just under a 10 percent target. Computed exactly at the distributed cutoffs, the rate is just over 10 percent in three of the four subgroups. Each printed value is within about two standard errors of the exact one, so the table is consistent with its own simulation; but the released code also estimates each posterior probability from a finite sampler chain, and run at that chain length it reproduces the printed values, so the small gap is of the size the chain produces and more simulated trials alone would not have closed it. (The paper’s own cutoffs were not archived, so this describes the design as released.)
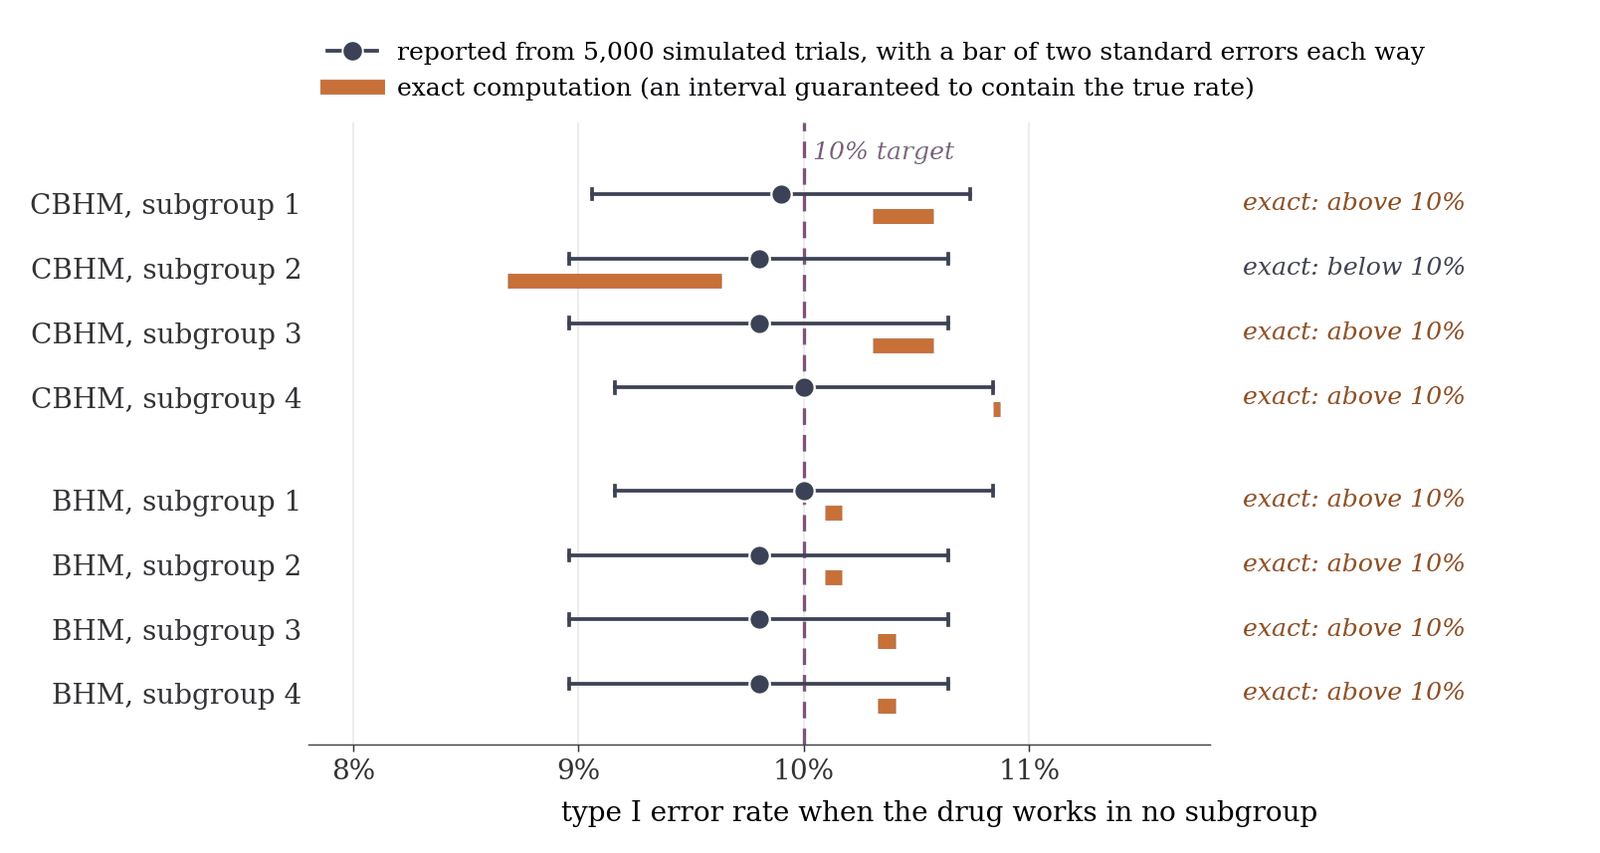
The CBHM calibration row and, below, its plain hierarchical-model comparator BHM. Slate dots: the type I error rates reported from 5,000 simulated trials, with two-standard-error bars. Orange: where the exact computation places the rate at the cutoffs released with the code. Every reported value is consistent with its orange interval, yet the exact rate is above the 10 percent target (dashed) in seven of the eight rows; the two entries printed as exactly 0.100 can be placed only by the exact computation. (Drawn from Table 6 of the paper.)
Of the thirty reversals, ten arise from calibration to a constraint, as in the Simon case, and two from test discretenesswith whole-number outcomes a test cannot attain its nominal error rate exactly, and the attainable rate jumps as the sample size changes, the subject of the third full recomputation: the actual type I error rate of BayesCTDesign’s test oscillates around its nominal 0.05 as the sample size changes, between 0.0488 and 0.0516 over the binomial-endpoint entries computed exactly. The other eighteen are plain Monte Carlo noise, ordinary estimates whose recomputed value falls across the threshold. In twenty of the thirty the recomputation evaluates the design paper’s own rule and cutoffs. The remaining ten are all entries of the CBHM paper, evaluated either at the cutoffs distributed with its code (five) or at cutoffs re-derived from its calibration rule (five). For those ten the comparison is with the design as released or as recalibrated, since the CBHM paper’s own calibrated cutoffs are not printed. Among the eleven entries that re-simulation left undecided is a Weibulla standard probability model for survival times, with a scale parameter and a shape parameter power entry printed as 0.798 that came out at 0.800021 after two million trials.
Reporting suggestions and limits
The results suggest four reporting items for the design classes examined, two of them already in the guidance. First, the number of simulated trials can be chosen in advance, by the second formula above, from the smallest margin the authors need to resolve, and reported with that calculation. Second, the Monte Carlo standard error can be printed beside every simulated operating characteristic, so that a reviewer can compare an estimate’s distance from its threshold with twice that number. Third, the decision rule can be published in full, with calibrated cutoffs, critical values, comparator rules and the random seed; where papers did so, their tables could be regenerated from the released code. Fourth, where the operating characteristic is a finite sum or a low-dimensional posterior integral, its exact value can be reported instead of an estimate, for the cost of the arithmetic alone.
The limits come from the corpus: nine papers is a small set, and the released code of four of the nine designs was too costly to rerun, so their close entries were settled only where an exact evaluator existed. The sibling pages on Medicare star ratings and the ozone air-quality standard take the same approach: compute exactly a quantity that in practice is approximated, and compare the published numbers with the exact value.
The paper
- Exact versus simulated operating characteristics of published adaptive and Bayesian trial designs (PDF) — Matthew D. Schwartz. A preliminary version of the paper.
Supplementary material
The two files below are stand-alone: the evaluation script needs only Python 3 and its standard library, and the two analysis scripts inside the archive need numpy, scipy, matplotlib and mpmath. The evaluation script reads the archive directly, so the two files are meant to sit in the same folder.
- trials-census.zip — the per-design cell files for all 1,076 entries, with the dated protocol documents and the analysis scripts, among them the one that draws Figure 1 of the paper; a manifest inside lists every file with its sha256.
- trials-evaluate.py — Python, standard library only. Reads the cell files straight from the archive, checks each against the manifest, and recomputes in exact arithmetic the tallies quoted on this page: 351 of 977, the 77 threshold-valued entries, the median of 45,697. It also computes from scratch the Simon comparator’s power of 0.80095 and the roughly 4.7 million runs the 0.0498 entry would need, in seconds.
References
| U.S. Food and Drug Administration, Adaptive designs for clinical trials of drugs and biologics: guidance for industry, U.S. Department of Health and Human Services (2019) | the guidance with the 100,000-trial worked example and the confidence-interval condition applied here |
| International Council for Harmonisation of Technical Requirements for Pharmaceuticals for Human Use, ICH E20: adaptive designs for clinical trials, draft guideline (2025) | the draft international guideline giving the same 100,000 example and asking that the count be justified |
| T. P. Morris, I. R. White and M. J. Crowther, Using simulation studies to evaluate statistical methods, Stat. Med. 38 (2019) 2074 | the Monte Carlo standard error of a simulated estimate and the number of repetitions a precision requires |
| E. Koehler, E. Brown and S. J.-P. A. Haneuse, On the assessment of Monte Carlo error in simulation-based statistical analyses, Am. Stat. 63 (2009) 155 | found Monte Carlo error rarely reported in published simulation-based analyses, and often material |
| K. Luijken et al., Replicability of simulation studies for the investigation of statistical methods: the RepliSims project, R. Soc. Open Sci. 11 (2024) 231003 | re-ran published simulation studies in biostatistics to measure how much results change on replication |
| R. Simon, Optimal two-stage designs for phase II clinical trials, Control. Clin. Trials 10 (1989) 1 | the two-stage template whose type I error rate and power are exact binomial sums |
| C. Jennison and B. W. Turnbull, Group Sequential Methods with Applications to Clinical Trials, Chapman & Hall/CRC, Boca Raton (2000) | operating characteristics of group-sequential designs from deterministic recursions, without simulation |
| H. Zhou, J. J. Lee and Y. Yuan, BOP2: Bayesian optimal design for phase II clinical trials with simple and complex endpoints, Stat. Med. 36 (2017) 3302 | BOP2, whose posterior stopping rule reduces to integer boundaries; one of the nine designs examined |
| Y. Chu and Y. Yuan, BLAST: Bayesian latent subgroup design for basket trials accounting for patient heterogeneity, J. R. Stat. Soc. C 67 (2018) 723 | BLAST, the basket design whose 99 entries, extracted in an earlier feasibility study, get only the margin comparison |
| N. Chen and J. J. Lee, Bayesian hierarchical classification and information sharing for clinical trials with subgroups and binary outcomes, Biom. J. 61 (2019) 1219 | BaCIS, the hierarchical basket design whose posterior tails reduce to nested one- and two-dimensional integrals |
| Y. Chu and Y. Yuan, A Bayesian basket trial design using a calibrated Bayesian hierarchical model, Clin. Trials 15 (2018) 149 | CBHM, the basket design whose calibration row is recomputed exactly above |
| Y. Liu, M. Kane, D. Esserman, O. Blaha, D. Zelterman and W. Wei, Bayesian local exchangeability design for phase II basket trials, Stat. Med. 41 (2022) 4367 | Local-MEM, whose Simon comparator has the exact power 0.80095 behind five reversals |
| B. S. Eggleston, J. G. Ibrahim, B. McNeil and D. Catellier, BayesCTDesign: an R package for Bayesian trial design using historical control data, J. Stat. Softw. 100(21) (2021) 1 | BayesCTDesign, whose test’s actual type I error rate oscillates around 0.05 with the sample size |
| J. He, R. Lin, Y. Chen and K. F. Lam, Two-stage double-arm trial optimal design of restricted mean survival time with sculpted critical region, Stat. Med. 45 (2026) e70589 | ScuRMST, whose 150 calibration entries cannot be recomputed because its critical values were not archived |
| T. L. Lai, P. W. Lavori and O. Y.-W. Liao, Adaptive choice of patient subgroup for comparing two treatments, Contemp. Clin. Trials 39 (2014) 191 | ASSISTant, adaptive subgroup choice with rank statistics; one of the nine designs examined |
| A. Granholm, A. K. G. Jensen, T. Lange, A. Perner, M. H. Møller and B. S. Kaas-Hansen, Designing and evaluating Bayesian advanced adaptive randomised clinical trials: a practical guide, Pharm. Stat. 24 (2025) e70042 | adaptr, whose null scenario was simulated at the 100,000 trials of the guidance example |