Medicare star ratings (health policy)
The content on this page was written by AI under human supervision.
Medicare rates private health plans, hospitals and patients’ experience of care with one to five stars, and for Medicare Advantage plans the stars set bonus payments worth billions of dollars a year. Six of these rating programs share one stated rule for placing the star boundaries: minimize the total squared distance of the scores from their bin centers. The paper behind this page computes that minimum exactly and finds that the published star bins often miss it.
Stars and money
The Centers for Medicare & Medicaid Services (CMS) publishes several star ratings; the paper examines six. Each Medicare Advantage contractthe unit in which Medicare’s private health plans are rated and paid; the paper identifies contracts only by CMS contract number and names no plan or hospital receives an overall rating each year, and a contract rated 4.0 stars or above earns a bonus under the Quality Bonus Program. The benchmark it is paid against rises by five percent per enrollee the following year; a contract at 3.5 gets no increase. These bonuses are estimated to total $13.4 billion for 2026. The Overall Hospital Quality Star Rating gives each hospital a single star rating on Medicare’s Care Compare site. Four patient-experience surveys of the CAHPS family (Consumer Assessment of Healthcare Providers and Systems) assign further stars to hospitals, home health agencies, hospices and dialysis facilities. Only the Medicare Advantage rating affects payments directly; the other five inform patients’ choices.
The Medicare Advantage ratings are also the subject of litigation, in which the paper takes no side. A 2024 ruling in a suit brought by SCAN Health Plan led CMS to recalculate that year’s ratings nationwide, and SCAN and Alignment Healthcare filed new suits in July 2026. The closest precedent for examining the clustering step itself is Bo Bayles’s 2017 finding that CMS’s hospital code stopped before its iteration had converged, which changed hundreds of ratings. Neither that work nor anything the author found in the literature, court dockets or public code tested the published cut points against the stated criterion.
The criterion and the algorithms
All six programs group the scores, placed on a line, into five bins, the star levels, so that the scores lie as close as possible to their bin centers; the regulations call the quantity to be minimized the within-cluster sum of squares,
$$\mathrm{SSQ} \;=\; \sum_{b=1}^{k} \sum_{i \in B_b} \bigl(x_i - \bar{x}_b\bigr)^2 ,$$where $x_1\le\dots\le x_n$ are the sorted scores, $B_1,\dots,B_k$ the bins ($k=5$) and $\bar{x}_b$ the mean score in bin $b$; each term is one score’s squared distance from its own bin’s mean. For Medicare Advantage the criterion is regulation text: 42 CFR 422.162(a) states that “The Star Ratings levels are assigned to the clusters that minimize the within-cluster sum of squares,” a sentence CMS’s annual Technical Notes repeat. A separate provision, 422.166(a)(2)(i), prescribes the method instead, “mean resampling with the hierarchal clustering.” The hospital methodology prescribes k-means clustering, whose objective is the same sum, and the four survey programs prescribe Ward’s hierarchical clustering with the same stated aim.
Neither Ward’s method nor k-means is guaranteed to reach the minimum. Ward’s method starts with every score in its own cluster and repeatedly merges the two clusters whose merger raises SSQ least; merging clusters $a$ and $b$, holding $n_a$ and $n_b$ scores with means $\bar{x}_a$ and $\bar{x}_b$, raises it by
$$\Delta(a,b) \;=\; \frac{n_a\, n_b}{n_a+n_b}\,\bigl(\bar{x}_a-\bar{x}_b\bigr)^2 ,$$and merging stops at five clusters. A merge is never undone, even when the best final grouping would separate the scores it joined. K-means, used for hospitals, starts instead from initial bin centers fixed by the code, moves a bin boundary whenever a single move lowers SSQ, and stops at a local optimum that depends on where it started.
For data of arbitrary dimension, minimizing SSQ is NP-hard, meaning that no known fast algorithm is guaranteed to find the minimum, so fast heuristics are used instead. On a line, an optimal grouping consists of consecutive runs of sorted scores, and the only question is where to put the $k-1$ cut points among the $n-1$ gaps. In 1958 Walter D. Fisher showed how to search those choices without repeating work, by dynamic programming. Writing $D_m(i)$ for the smallest SSQ achievable when the first $i$ sorted scores fill $m$ bins,
$$D_m(i) \;=\; \min_{m\le j\le i}\bigl\{\, D_{m-1}(j-1) + \mathrm{SSQ}(x_j,\dots,x_i) \,\bigr\} ,$$where $\mathrm{SSQ}(x_j,\dots,x_i)$ is the sum of squares of a single bin holding scores $j$ through $i$. In words, the best split of $i$ scores into $m$ bins is the best split of a shorter initial run into $m-1$ bins plus one final bin, minimized over where that bin begins. The final value, $D_k(n)$, is the exact minimum, and a variant lists every grouping attaining it, which shows whether the optimum is unique. The paper runs this and every comparison in exact rational arithmetic.
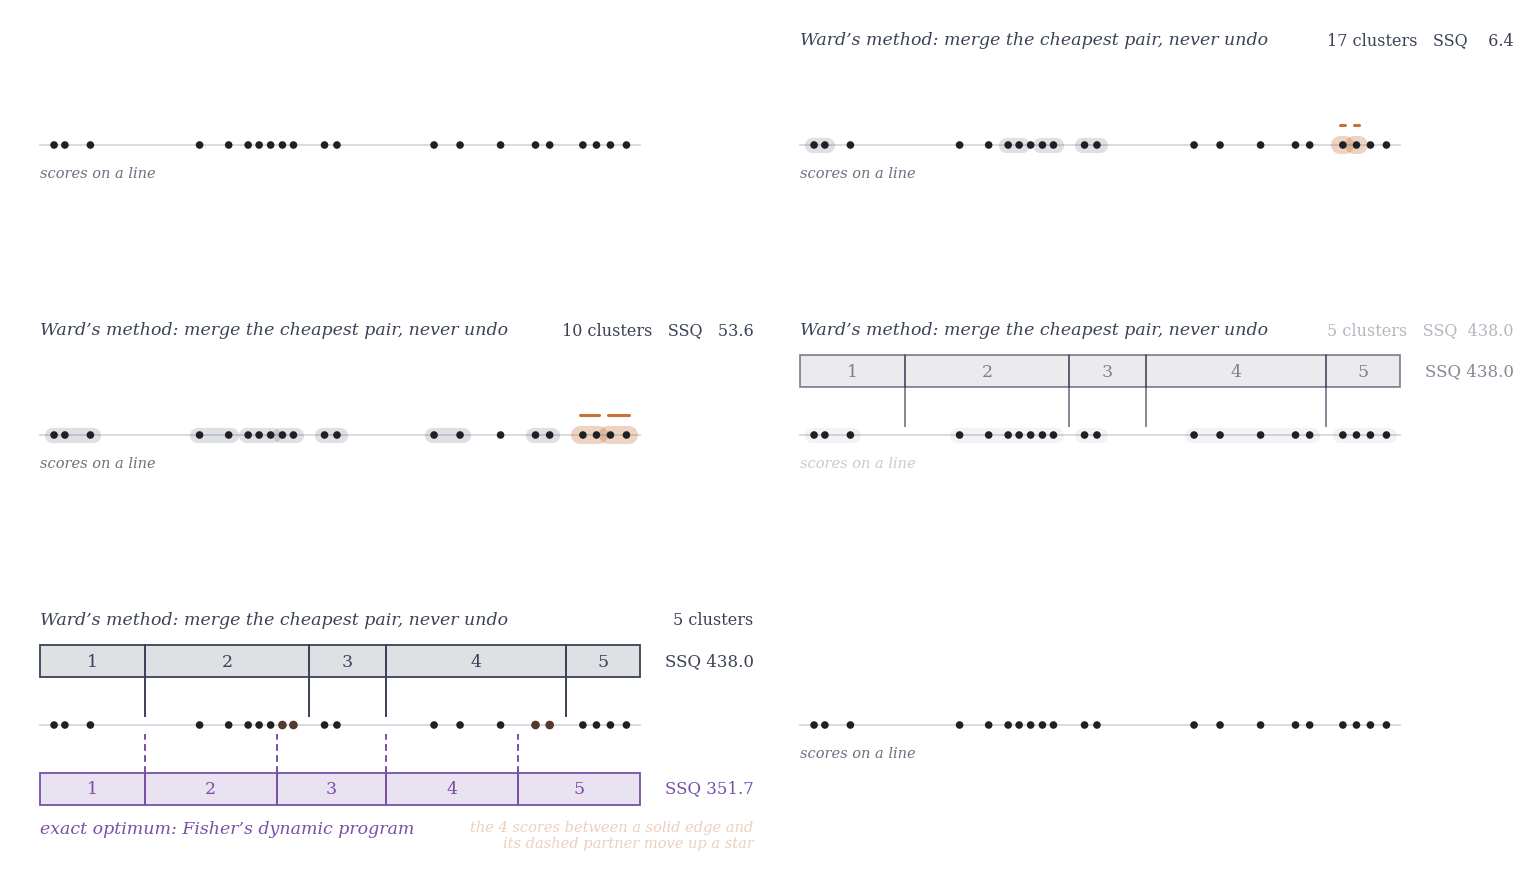
The two computations on 21 made-up scores (a toy example drawn for this page, not CMS data; bins are numbered 1 to 5 from low scores to high). Ward’s method merges the pair of clusters whose union raises SSQ least, one merge at a time and never undoing one, until five remain; the slate ruler above the dots shows the resulting star bins, with solid edges, and their SSQ. Fisher’s dynamic program then finds the grouping with the smallest SSQ of all, the violet ruler below, with dashed edges. Here the greedy merges stop at SSQ 438.0 against a minimum of 351.7, two of the four optimal edges lie to the left of Ward’s, and the four scores between a solid edge and its dashed partner (orange) sit one bin higher under the optimum. The figures below draw CMS’s published bins and the exact optimum in the same way.
The hospital ratings
The hospital program is the most open of the six: CMS publishes the code (in the statistical languages SAS for rating years 2021–2025 and R for 2026), the input files and the stars, and no step is randomized. Run unmodified, the 2026 R package matches the published Care Compare star for all 3,182 hospitals that have a star in both its output and the published file. The SAS packages, with one proprietary k-means routine reimplemented from its documentation, reproduce every published star of 2021–2025. (Code and inputs come from public GitHub mirrors of CMS’s releases.) Hospitals are binned within peer groupspeer group 3, 4 or 5: hospitals reporting enough measures to be scored in three, four or all five of the method’s measure groups; in 2026 the groups held 177, 749 and 2,277 hospitals. In 2026 the exact optimum on the same scores assigns a different star to 205 of the 3,182 displayed hospitals, 6.4 percent, every one of them higher. All twelve published cut points that year lie above their optimal counterparts, so the hospitals that differ are those caught between a published cut point and its optimal partner (shown below for one peer group).
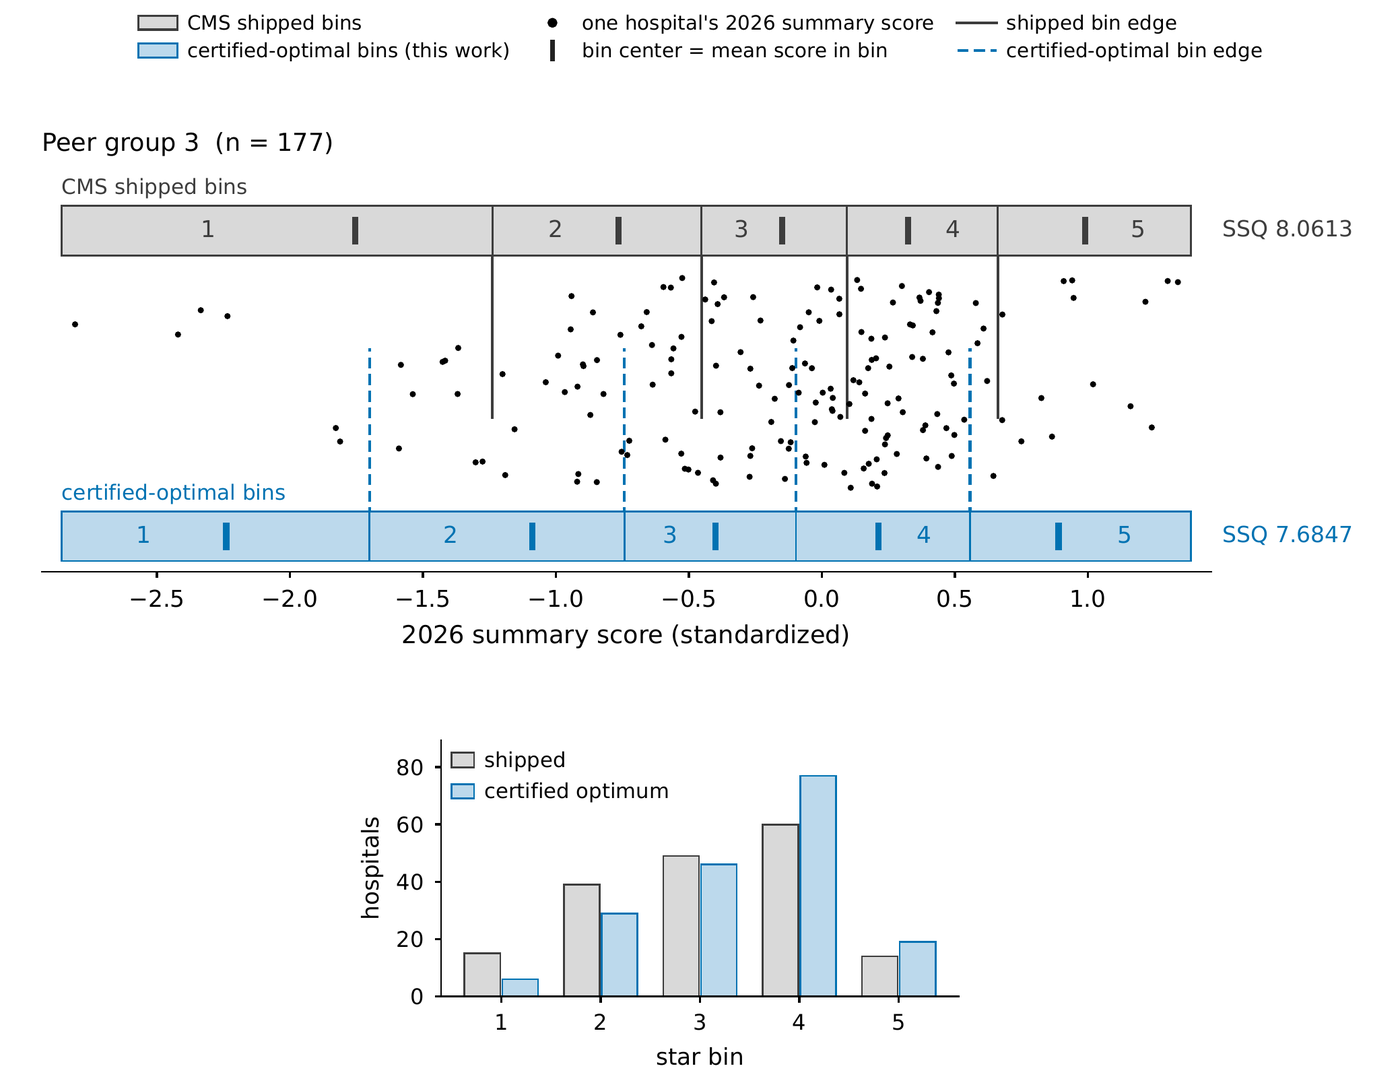
One of the three hospital peer groups in 2026 (177 hospitals), each hospital a dot at its summary score; the vertical spread is jitter only. The gray ruler above shows the five star bins CMS published, with solid edges; the blue ruler below shows the bins of the exact optimum of the stated criterion, with dashed edges (the figure’s own labels are “CMS shipped bins” and “certified-optimal bins”). Thick ticks mark each bin’s mean score, and each grouping’s SSQ is printed at the right: 8.0613 published, 7.6847 optimal. Every published edge lies to the right of its optimal partner, so the 55 hospitals between a solid line and its dashed partner receive one star fewer than the optimum assigns; the bar chart beneath shows the bin populations shifting upward. Across all three peer groups 213 of 3,203 rated hospitals differ at the clustering step, 208 after a safety cap that holds some hospitals to four stars, and 205 among the 3,182 with a displayed star. (Figure 1 of the paper.)
The 2026 k-means iteration does converge, after two steps in each peer group. The published grouping is therefore a genuine local optimum, fixed by the code’s starting centers, whose SSQ still exceeds the minimum; in the 2017 case the iteration had stopped early. Over the six rating years the optimum differs from the published grouping in 1,146 of 18,493 stars issued and is unique in all eighteen peer-group computations. The paper adds that the criterion is nearly flat near the optimum: in 2026 most of the 213 hospitals that differ at the clustering step regain their published star under some grouping nearer the optimum than CMS’s. The direction of the differences varies by year (in 2024, 15 up and 258 down), and the paper presents the all-upward pattern of 2026 as a fact about that year, not a rule.
The Medicare Advantage cut points
In Medicare Advantage, CMS clusters contract scores separately for each quality measure, so every measure in every star year has its own cut points, the thresholds that determine whether an 87 percent screening rate is worth three stars or four. The paper calls one such calculation a computation; star years 2024–2026 contain 123. Under the Technical Notes, outlying scores beyond a quartile-based fence are trimmed and a SAS procedure assigns the remaining contracts at random to ten equal groups. Ten times, one group is set aside and the rest are clustered by Ward’s method, and the ten values of each cut point are averaged; this is the regulation’s “mean resampling,” a delete-one-group jackknifea resampling scheme that recomputes a statistic with one block of the data left out at a time and averages the results. CMS then applies a guardrailCMS’s term for the cap on how far a measure’s cut point may move from its prior-year value; in the worked example below the window is the prior-year cut point plus or minus 0.04 capping each cut point’s movement from the prior year, rounds, and aggregates the resulting measure stars into each contract’s overall rating.
CMS does not publish which scores entered each computation, so the paper rebuilds each clustering sample from the public score files under the documented exclusion rules. The two fence values the Notes print for every computation serve as a check: the rules alone reproduce them in 82 of the 123 computations, and for the rest the paper fits score profiles for unpublished contracts. On each sample it runs the clustering step both ways, Ward’s method and Fisher’s dynamic program, before any resampling, guardrail or rounding. The Ward grouping’s SSQ is strictly above the minimum in 104 of the 123 computations (104 to 106 across three reconstructions of the samples, and still 103 when every fitted profile is dropped) and equal to it in 16; three are degenerate (all scores identical, or too few distinct values). In all 120 non-degenerate computations the optimal grouping is unique. The gaps, plotted below, span seven orders of magnitude. When the contracts are rescored against the optimal cut points, 9,809 of the 47,752 contract-measure stars assigned by these computations change, about one in five.
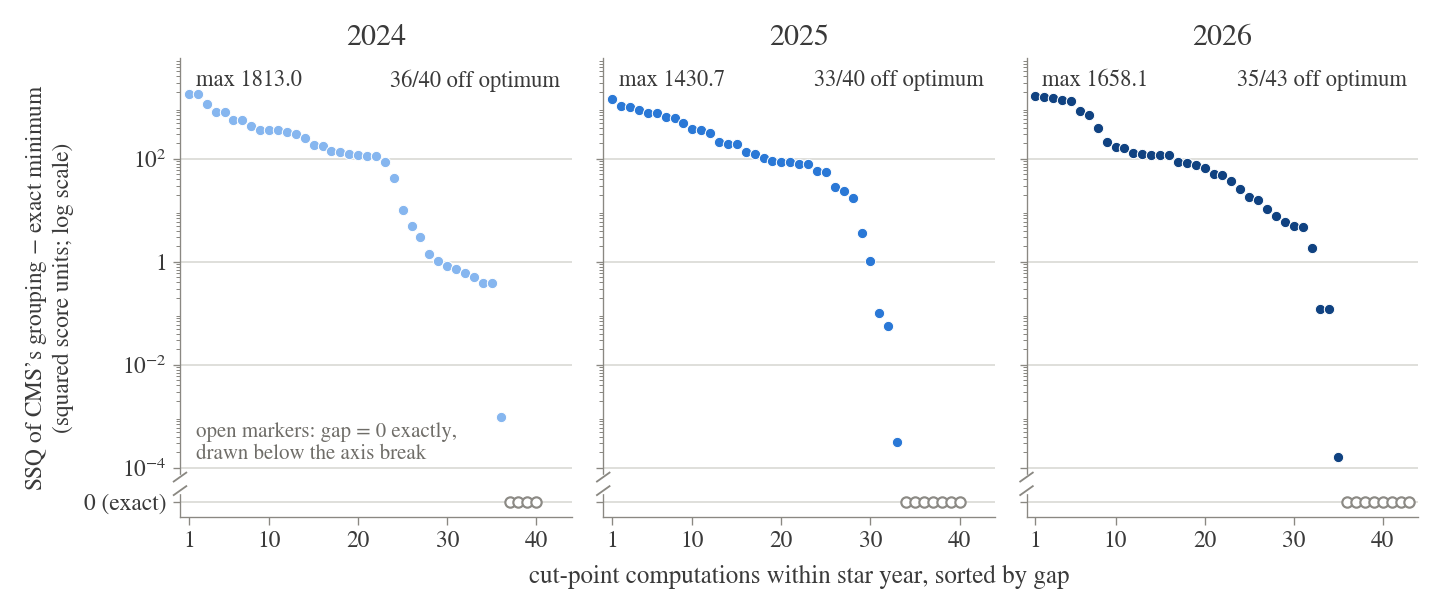
For each of the 123 cut-point computations of star years 2024–2026, the amount by which the SSQ of CMS’s Ward grouping exceeds the exact minimum on the same trimmed sample, one panel per year, sorted by size and drawn on a logarithmic axis because the gaps run from below 0.0002 to above 1,800 in each measure’s squared score units. Filled dots are the 104 computations that miss the minimum (36 of 40, 33 of 40 and 35 of 43 by year); open circles below the axis break are the 19 with gap exactly zero, the 16 that attain the minimum and three degenerate ones. The comparison is made before resampling, the guardrail and rounding, on clustering samples reconstructed from the documented rules with fitted score profiles. In most computations of every year the prescribed clustering step does not reach the minimum of the criterion stated in the program’s own rules. (Figure 2 of the paper.)
Across the bonus line
A different cut point changes a payment only if it moves a contract’s overall rating across 4.0. The paper runs the full-sample optimal cut points through the later published stages (guardrail, rounding, aggregation) and compares the resulting ratings with the stars CMS assigned, under seven stated conventions. One convention holds the improvement and survey measures at their published stars, since their inputs are unpublished or not clustered; the count of changed ratings is therefore conditional on those stars and could be larger or smaller. Sixty contract-years change bonus status. Of these, 34 are valued in dollars (31 distinct contracts; the 34 are among 1,724 published contract-year ratings), sixteen crossing upward and eighteen downward; the other 26 have no bonus program, no published overall rating, or a status the paper could not determine. At $400–600 per enrollee-year, a band the paper calls a reference value and not a measurement, the bonus payments that depend on these 34 changes total an estimated gross $0.9 to $1.4 billion over payment years 2025 through 2027. At the $1,146 million midpoint, $130.3 million comes from the upward changes and $1,015.3 million from the downward ones; the two are not netted. These are estimates, the paper stresses, and imply nothing about the conduct of any contract or of CMS.
The dollar total is concentrated: one contract-year, H0524 in star year 2024, accounts for 59.2 percent of the valued enrollment (1,355,332 enrollee-years, $542–814 million), and its published rating is only about 0.030 above the 3.75 rounding edge where the displayed star changes. Contracts move both ways because the optimal cut points are neither uniformly harder nor uniformly easier than CMS’s. The guardrail then determines which differences reach the stars (figure below): where the cap binds it clamps the cut point identically under both methods, and elsewhere the difference passes through. Of the 60 changes, 33 involve a clamped measure, and without the guardrail 18 would disappear, all upward.
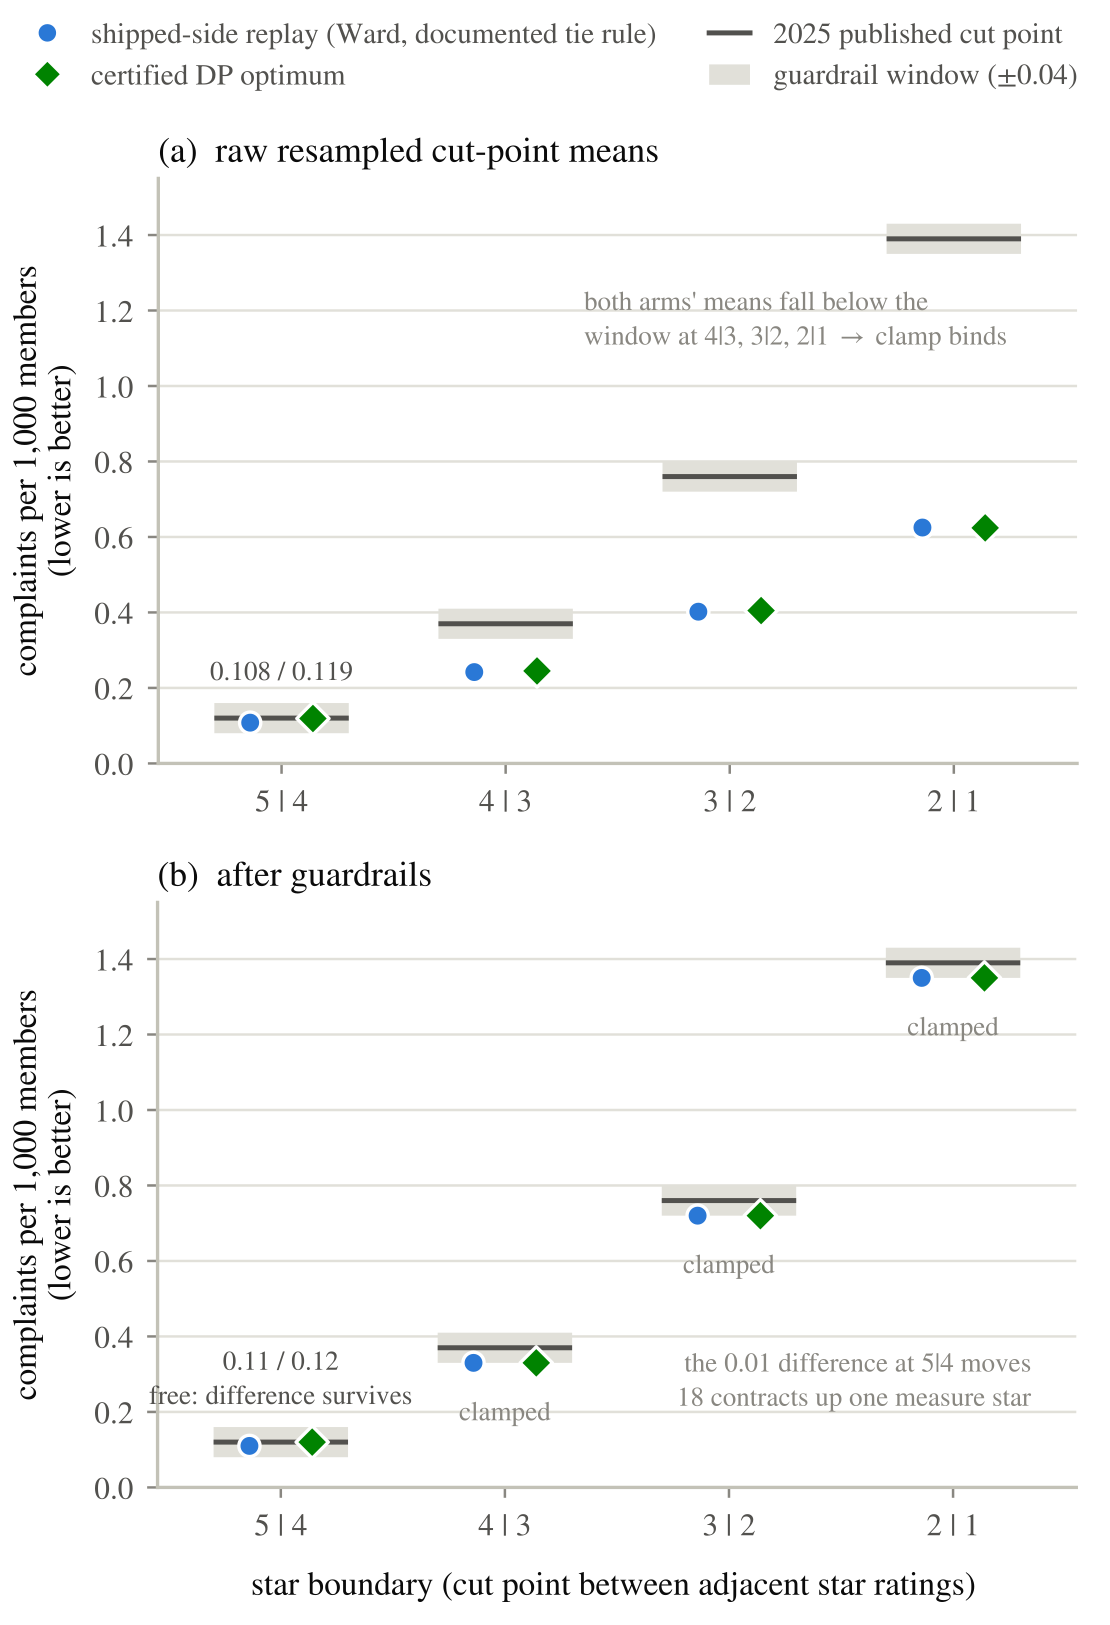
One Medicare Advantage measure, Complaints about the Health Plan (a Part C, or medical-plan, measure; star year 2026), followed through the guardrail. At each of the four star boundaries the dark line is the prior-year published cut point and the gray band the guardrail window around it, plus or minus 0.04. Blue circles are the resampled cut-point means from Ward’s method and green diamonds those from the exact optimum (labeled “certified DP optimum” in the figure). In the upper panel, before the guardrail, both methods fall below the window at three boundaries; in the lower panel, after it, those three are clamped to the window’s edge identically for both methods, and only the 5|4 boundary keeps its 0.01 difference (0.11 against 0.12), which in the illustrative group assignment drawn here moves 18 contracts up one measure star. The clamp acts identically at every assignment; the surviving difference and the count of 18 are specific to this one. Where the guardrail binds it removes the difference between the two methods, and where it does not, the difference reaches the stars. (Figure 3 of the paper.)
The unpublished input order
Two things missing from the published files keep CMS’s own resampled computation from being rerun: the exact set of scores that entered each computation, and the full specification of its one random step. The Technical Notes print the SAS call that assigns contracts to the ten groups, seed included (8675309, which “allows for future replication of the randomization process”). The assignment also depends on the unpublished order in which the contracts were read (and, in two of the years, on which random-number generator ran). The Notes do not spell out the assignment rule itself; the paper states the rule it assumes and, under that assumption, recomputes every contract’s bonus status at 28 sampled input orders. Under different orders, 118 contract-years fall on different sides of the bonus line, so the published files leave their status undetermined (a statement about the files, the paper adds, not about any contract).
The paper expresses the dependence on the input order in dollars, as the expected gross bonus payments, over one randomly drawn order, of the contracts whose status under that order differs from their usual one. With Ward’s method inside the ten groups, as CMS runs it, the expectation is $787.2 million; with the exact optimum inside the same groups it is $98.4 million, smaller by a factor of eight (each figure measures one method’s own variation with the order, not the difference between the methods, which at any single order still disagree on the bonus status of 26 to 47 valued contract-years). Publishing one production run’s clustering input file (each computation’s scores in the order read) or its group assignment would settle every such case; for the two earlier years the generator is also needed. The input order alone would not suffice, since each clustering sample is a reconstruction that can be checked against the published fence values but is not fixed by them.
The patient surveys
No payment depends on the survey stars. Two of the four programs publish the clustered scores; the home health and hospice surveys publish only stars and cannot be checked. For the hospital survey (HCAHPS), the paper examines five quarterly refreshes (April 2025 to May 2026) and the eight measures starred in all five. The published grouping misses the minimum in 38 of the 40 refresh-measure cells, and regrouping to the optimum moves 17,484 hospital-measure stars, in both directions. However, Ward’s method run on the public file recovers only one of the eight published groupings on the May 2026 refresh. If CMS runs the Ward step as the notes describe it, its inputs are therefore not exactly the file’s scores, and these divergences mix input differences with the algorithm’s shortfall. Patients see one summary star per hospital, built from the per-measure stars by a published rule; applied to the optimal per-measure stars, that rule changes the summary star of 413 of 3,176 hospitals (13.0 percent) on the May 2026 refresh.
For the dialysis survey (ICH CAHPS) the algorithm can be tested on its own. The survey’s April 2026 file contains the clustered quantity itself, a linearized 0–100 score for each of 2,594 facilities on six measures. Ward’s method applied to that file reproduces five of the six published groupings identically and the sixth up to ties, which confirms the inputs. None of the six published groupings attains the minimum, and each optimum is unique. Regrouping moves 4,061 facility-measure stars, about 26 percent of the 15,564 in the file, from 3 percent of facilities on one measure to 40 percent on each of the two shown below. On every measure the moves run one way only, up on five and down on one.
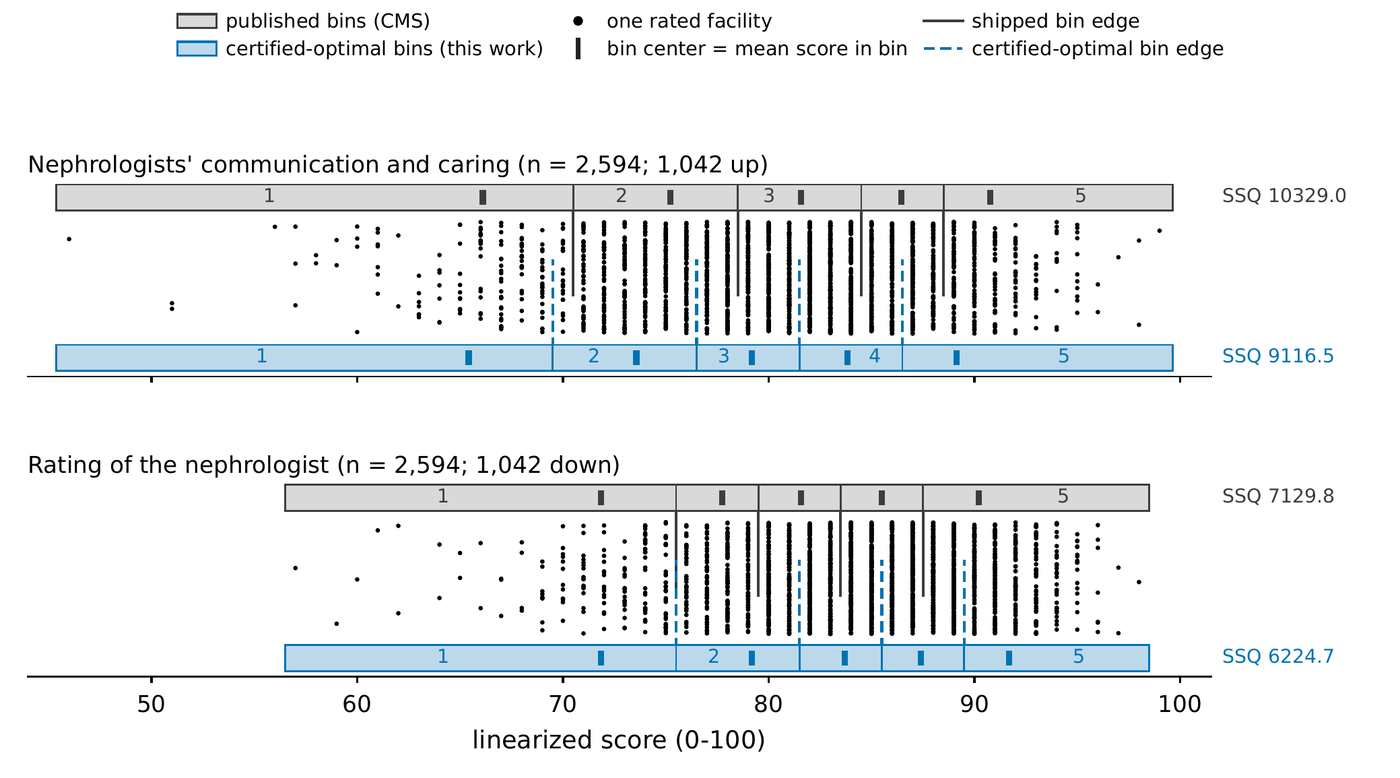
The two most-affected measures of the dialysis-facility survey (ICH CAHPS, April 2026 file), drawn as in the hospital figure: each of 2,594 facilities is a dot at its published score, the gray ruler above shows the published star bins and the blue ruler below those of the exact optimum, with each grouping’s SSQ at the right. On nephrologists’ communication and caring (top) every optimal edge lies below its published partner and 1,042 facilities, 40 percent, move up; on rating of the nephrologist (bottom) the lowest edge is unchanged, the other three optimal edges lie above their partners, and 1,042 facilities move down. The optimal SSQ is strictly lower on both (9,116.5 against 10,329.0; 6,224.7 against 7,129.8). Here the published scores are confirmed to be CMS’s inputs, so the whole difference is the algorithm’s. (Figure 4 of the paper.)
Scope and open questions
The paper attributes no error to anyone. Because both algorithms are deterministic, a published computation can be reproduced exactly without revealing how far it is from the optimum, and that distance could persist for years without a mistake by anyone. Which of the two Medicare Advantage provisions controls is a question for the courts, and the paper leaves it aside. If the method is read as the rule, the paper measures how far the method falls short of the objective; if the objective is read as the rule, it measures payments that may have been misdirected. The result concerns specific contracts, whose bonus status differs under the two computations, rather than any aggregate tendency to rate too generously or too harshly.
The paper lists its own limitations: the dollar figures depend on the seven conventions, the per-enrollee band and a handful of large contracts. The Medicare Advantage clustering samples are reconstructions, and some of the valued changes depend on the fitted score profiles in them. The hospital comparison rests on mirrored code, and the two survey comparisons take the technical notes’ description of the inputs as given; for the hospital survey, CMS’s inputs are evidently not exactly the public file’s scores. The court rulings that have altered the ratings so far each turned on one element of the methodology; none reached the question measured here. CMS’s rule for 2027 provides for displaying de-identified sample data “needed to replicate the cut point methodology,” though the author could not perform that replication from the documents published so far. A proposal to replace clustering with percentile cut points was deferred, so clustering remains the method in force.
The paper
- Stars misaligned: Medicare star ratings and the exact optimum of their clustering criterion (PDF) — Matthew D. Schwartz; the version served here is a draft marked preliminary. Computes the exact minimum of the clustering criterion in the rules of six Medicare star-rating programs and compares it with the star groupings CMS published for hospitals, for Medicare Advantage measures and for two patient surveys. For Medicare Advantage it also estimates the bonus payments of the contracts whose bonus status differs under the two computations.
Supplementary material
The paper’s materials are hosted on this site. The two files below rerun the Medicare Advantage cut-point comparison with Python alone; the full record package behind the paper is being re-issued.
- stars-evaluate.py — Python, standard library only. Reruns Fisher’s dynamic program in exact rational arithmetic on every sample in ma-cutpoint-rows.json and checks the published grouping’s SSQ, the optimal SSQ, the gap between them, the uniqueness of the optimum and the count of changed stars against the recorded values. The default run covers the 43 computations of star year 2026;
--fullcovers all 123 and checks the 104-of-123 and 9,809-of-47,752 tallies. - ma-cutpoint-rows.json — the 123 reconstructed clustering samples of star years 2024–2026, one per cut-point computation: the sorted scores as exact decimal strings, with the published and optimal cut points and both SSQ values (as exact fractions) beside each. The header pins the parsed CMS score files it was built from by SHA-256 hash.
- Record package — being re-issued; it will be linked here when available.
References
| Code of Federal Regulations, 42 C.F.R. § 422.162: Medicare Advantage Quality Rating System and 42 C.F.R. § 422.166: Calculation of Star Ratings, ecfr.gov (accessed 2026) | the regulation text: the sum-of-squares criterion in 422.162(a), the prescribed method in 422.166(a)(2)(i) |
| Centers for Medicare & Medicaid Services, Medicare 2026 Part C & D Star Ratings Technical Notes, technical report (2025); the 2024 and 2025 editions likewise | restate the criterion and document the trimming, the ten-group resampling and its seed, and the guardrail |
| W. D. Fisher, On grouping for maximum homogeneity, J. Am. Stat. Assoc. 53 (1958) 789 | the dynamic program that finds the exact minimum for scores on a line |
| D. Aloise, A. Deshpande, P. Hansen and P. Popat, NP-hardness of Euclidean sum-of-squares clustering, Mach. Learn. 75 (2009) 245 | minimizing the criterion is NP-hard for data of arbitrary dimension |
| H. Wang and M. Song, Ckmeans.1d.dp: Optimal k-means clustering in one dimension by dynamic programming, The R Journal 3 (2011) 29 | Fisher’s algorithm in standard statistical software, an R package |
| B. Bayles, The fault is not in our stars, but in ourselves, web post, bbayles.com (2017) | found that CMS’s 2017 hospital k-means code stopped before converging, changing hundreds of ratings |
| R.-H. Huang, rstarating: CMS Hospital Compare Star Rating SAS Pack Replica, software repository, github.com/huangrh/rstarating (2017) | reimplemented the 2017 hospital code and put the affected share near one quarter |
| M. E. Barclay, M. Dixon-Woods and G. Lyratzopoulos, Concordance of hospital ranks and category ratings using the current technical specification of US hospital star ratings and reasonable alternative specifications, JAMA Health Forum 3 (2022) e221006 | varied earlier steps of the 2021 hospital computation, clustering held fixed; about half of hospitals changed star |
| H. Rogers and M. Smith, Recalculating Medicare Advantage: Potential SCAN and Elevance ruling implications for MA stakeholders, white paper, Milliman (2024) | replicates CMS’s published Medicare Advantage computation and runs counterfactuals for the 2024 SCAN ruling |
| M. Darden and I. M. McCarthy, The star treatment: Estimating the impact of star ratings on Medicare Advantage enrollments, J. Hum. Resour. 50 (2015) 980 | the published stars as data: effects of the bonus threshold on payments and enrollment |
| A. Anderson and M. K. Meiselbach, Fluctuating Star Ratings and Medicare Advantage bonuses, JAMA Health Forum 6 (2025) e254398 | year-to-year instability of the published ratings and the bonuses that follow them |
| B. Vatter, Quality disclosure and regulation: Scoring design in Medicare Advantage, Econometrica 93 (2025) 959 | the design of Medicare Advantage scoring rules, taking the published computation as given |