The ozone standard (environmental policy)
The content on this page was written by AI under human supervision.
The United States limits ozone in outdoor air to 70 parts per billion, and whether a place meets the limit is decided by a calculation written into federal regulation. That calculation discards digits, by truncation rather than rounding, at three separate steps. The paper behind this page recomputes the borderline cases of 2020–2025 from public monitoring data and counts how many attainment determinations turn on where the digits are cut.
The ozone standard and the design value
Under the Clean Air Act, the Environmental Protection Agency (EPA) sets National Ambient Air Quality Standards and determines, region by region, whether the air meets them. For each monitoring site one statistic, the design value, is compared with the level of the standard. For ozone the level, set in 2015, is 70 parts per billion (ppb), written in the regulation as 0.070 parts per million (ppm). The design value is built in stages. A monitor reports hourly concentrations; these are combined into eight-hour averages, seventeen per day beginning at each hour from 7:00 a.m. through 11:00 p.m., and each day is scored by the highest of them. Each year contributes its fourth-highest daily maximum, and the design value is the average of three consecutive years’ fourth-highest values. The site attains if the design value is “less than or equal to” 0.070 ppm. Fine particulate matter, PM2.5, has two design values of its own under the same part of the Code of Federal Regulations, 40 CFR Part 50, against levels of 9.0 and 35 micrograms per cubic meter. The two pollutants belong together here because the regulation treats their last digits differently: Appendix U to Part 50, for ozone, truncates, and Appendix N, for PM2.5, rounds.
A great deal rides on whether a site attains. A nonattainment designation triggers mandatory state implementation plans and permitting constraints on industry. Recent determinations have turned on the last digit: in 2022 Atlanta attained the 2015 ozone standard at 0.070 ppm, while Washington, DC, St. Louis and Milwaukee, at 0.071, failed to attain and were reclassified from Marginal to Moderate nonattainment.
Where the digits go
A computed average carries more digits than the standard, so the rule must say what happens to the extras. Truncation drops them: a three-year mean of 0.0706… ppm is reported as 0.070 and attains. Rounding goes to the nearest value: the same mean becomes 0.071 and violates. One final truncation lets a mean as high as 70.9 ppb attain, while one final rounding stops at 70.4. At the last digit, then, the conventions differ by half a part per billion, the quantity in dispute in EPA’s docketsthe public file of a federal rulemaking, holding the proposal, the comments received and the supporting documents.
The paper starts from the observation that the final digit is one of three places where Appendix U discards digits, in nearly identical words each time. The hourly concentrations are cut before they are even reported: “Hourly average O3 concentrations shall be reported in parts per million (ppm) to the third decimal place, with additional digits to the right of the third decimal place truncated” (§3(a)). Then “The 8-hour averages shall be reported to three decimal places, with additional digits to the right of the third decimal place truncated” (§3(b)), and finally “Design values shall be reported in ppm to three decimal places,” again with the further digits “truncated” (§3(e)). In symbols, the calculation from the reported values is
$$X_y=\mathop{\mathrm{fourth}}_{d\in D_y}\ \max_{1\le w\le 17}\ \operatorname{tr}\!\Big(\frac{1}{n_{d,w}}\sum_{h\in H_{d,w}}c_{d,h}\Big),\qquad \mathrm{DV}=\operatorname{tr}\!\Big(\frac{X_1+X_2+X_3}{3}\Big),\qquad \text{attainment}\iff\mathrm{DV}\le 0.070\ \mathrm{ppm}.$$Here $c_{d,h}$ is the reported hourly concentration, in ppm, for hour $h$ of day $d$, already a whole number of ppb; $H_{d,w}$ is the set of reported hours in the $w$-th eight-hour period of that day and $n_{d,w}$ their number (eight, or six or seven with missing hours). $D_y$ is the set of valid days of year $y$; “fourth” picks the fourth-highest value; $\operatorname{tr}$ truncates to 0.001 ppm, a whole ppb; and $\mathrm{DV}$ is the design value. An eight-hour average of whole numbers is a multiple of one eighth (or sixth or seventh) of a ppb, and its truncation discards that fraction; a three-year mean of whole numbers is a multiple of one third of a ppb, and its truncation discards the thirds. No cut can move the number up, so the losses accumulate instead of canceling.
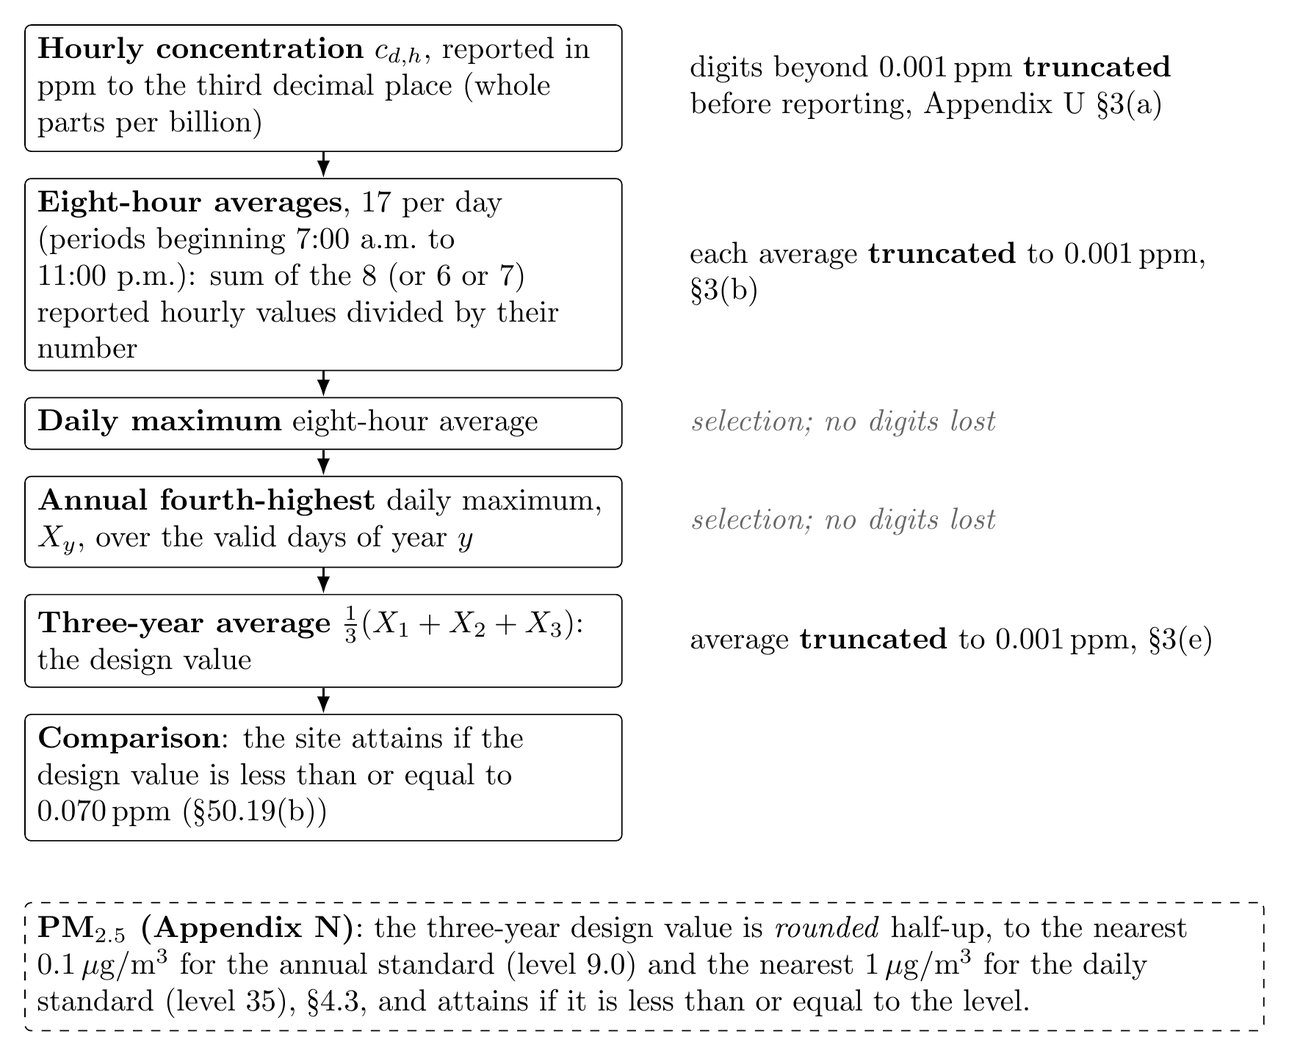
The ozone design-value calculation of 40 CFR Part 50, Appendix U, stage by stage, with the three points at which digits are discarded noted on the right: at the hourly concentration before it is reported (§3(a)), at each of a day’s 17 eight-hour averages (§3(b)), and at the three-year average (§3(e)), which is then compared with 0.070 ppm. The daily maximum and the annual fourth-highest value are selections and lose no digits. The first truncation precedes reporting and cannot be undone from public data; the second and third act on quantities computed from the reported values, so their effect can be recomputed. The dashed box gives the corresponding final step for PM2.5, where Appendix N rounds half-up instead. (Figure 1 of the paper.)
Three decades of comment and response
The question of truncation versus rounding has a long paper trail, which the paper tabulates from 1997 to 2025. It was raised in journal papers of the 1990s; Fairley, in a 1999 study of overshoot bias, concluded that “rounding may tend to misclassify nonattainment areas as attainment.” EPA solicited and answered comment on the convention in two rulemakings, 1997 and 2008. Both times environmental and health organizations supported the more stringent alternative and industry associations the existing one. Both times EPA declined to change, in 2008 on the stated ground that “the 8-hour design value has an uncertainty of approximately 0.001 ppm.”
Then, in January 2010, EPA itself proposed to end the truncation. Section V.G of its ozone reconsideration proposal, “Truncation Versus Rounding,” states: “The effect of this repeated truncation is that there is a consistent downward bias in the calculation of the three-year design value. The size of this bias can be notable.” The proposed remedy was to retain all digits through the computation and round the three-year average once. In September 2011 the Administration withdrew the proposal, and EPA did not pursue the change in any later ozone rulemaking. In 2022 Sierra Club told EPA that its “truncation conventions in the calculation of design values have no scientific basis,” estimating “up to approximately 1.6 parts per billion of under-protection.” That objection is pending in a review that has not concluded. To the author’s knowledge, none of these documents counts the actual determinations that depend on the conventions. That statement is limited by the scope of the author’s search, which covered the Federal Register, the regulations.gov dockets, the CourtListener case-law database and a general web search of limited depth.
What the paper computes
EPA’s Design Value Reports for the four evaluation periods 2020–2022 through 2023–2025 list 13,250 site-level design values, one for each monitoring site and period (a site-period), 4,929 of them for ozone. The paper calls a value borderline if it lies within one unit in the last reported digit of its standard, and there are 340: 202 ozone values published at exactly 0.070 ppm, and 92 annual and 46 daily PM2.5 values at the 9.0 and 35 boundaries. Each is recalculated from EPA’s public Air Quality System (AQS) AirData files, hourly for ozone and daily for PM2.5, step by step as Appendices U and N prescribe, in exact fractions. Exactness matters at ties: a computed value that lands exactly on a threshold must be recognized as equal to it, so that the comparison written in the rule decides the outcome.
The recalculation reproduces EPA’s published values. Of the 340 borderline values, 330 can be calculated from the public files, and every one equals the published design value; for 283 the agreement holds all the way down from the hourly concentrations. EPA applies the conventions exactly as written, so every dependence on a convention counted below arises from the rule itself, applied to the measurements as reported.
Each of the 304 borderline values that are also valid under the completeness rules (190 ozone, 75 annual and 39 daily PM2.5) is then recalculated with the measurements fixed and one provision changed: the final-digit rule, the comparison, or the completeness requirements. For ozone the paper also replaces the eight-hour truncation, under four procedures applied to the same reported hourly integers: (a) as written; (b) rounding at both steps; (c) the eight-hour averages carried untruncated to one final rounding, EPA’s 2010 proposal; (d) the same with one final truncation. A second implementation written from the regulatory text alone, applied to a sample of twenty-five site-periods, agreed with the first in each of 281 comparisons.
What turns on the last digit
Among the 304 valid borderline values, the final digit decides roughly one determination in three, in opposite directions for the two pollutants. For ozone, 61 of 190 borderline values attain only because Appendix U truncates; rounded, each would be published as 0.071. For PM2.5, 33 of 75 annual and 14 of 39 daily values violate only because Appendix N rounds. So a computed value that exceeds its standard by a given fraction of the last digit can attain for ozone and violate for PM2.5, within one body of regulation. (For PM2.5 all four periods are measured against the levels in force since 2024; for the 2020–2022 annual values that is not the legally operative determination of the time.) The comparison operator matters only when a value equals the level exactly, which is common: 257 of the 304 do, and each attains because the comparison is inclusive. A third provision is one-sided by construction: both appendices relax or waive the data-completeness requirements for a violating value but not for an attaining one. The paper counts how often that waiver operates, 8 to 18 valid ozone violations per evaluation period, and gives its evident rationale (an observed exceedance is evidence however many other days went unmeasured) rather than arguing against it.
One site shows two conventions acting at once. At the New Haven, Connecticut, monitor (site 09-009-0027) EPA published 0.070 ppm, the largest value that attains, for 2020–2022, 2021–2023 and 2023–2025, and a violating 0.072 for 2022–2024. Kept as fractions, the three attaining three-year means are
$$\frac{211}{3000},\ \ \frac{212}{3000},\ \ \frac{211}{3000}\ \mathrm{ppm}\;=\;70\tfrac{1}{3},\ \ 70\tfrac{2}{3},\ \ 70\tfrac{1}{3}\ \mathrm{ppb}.$$All three truncate to 0.070 and attain only because the comparison is “less than or equal to.” The middle one also attains only through truncation, since rounding $70\tfrac{2}{3}$ as the same regulation prescribes for PM2.5 would give a published value of 0.071; its determination turns on two conventions together.
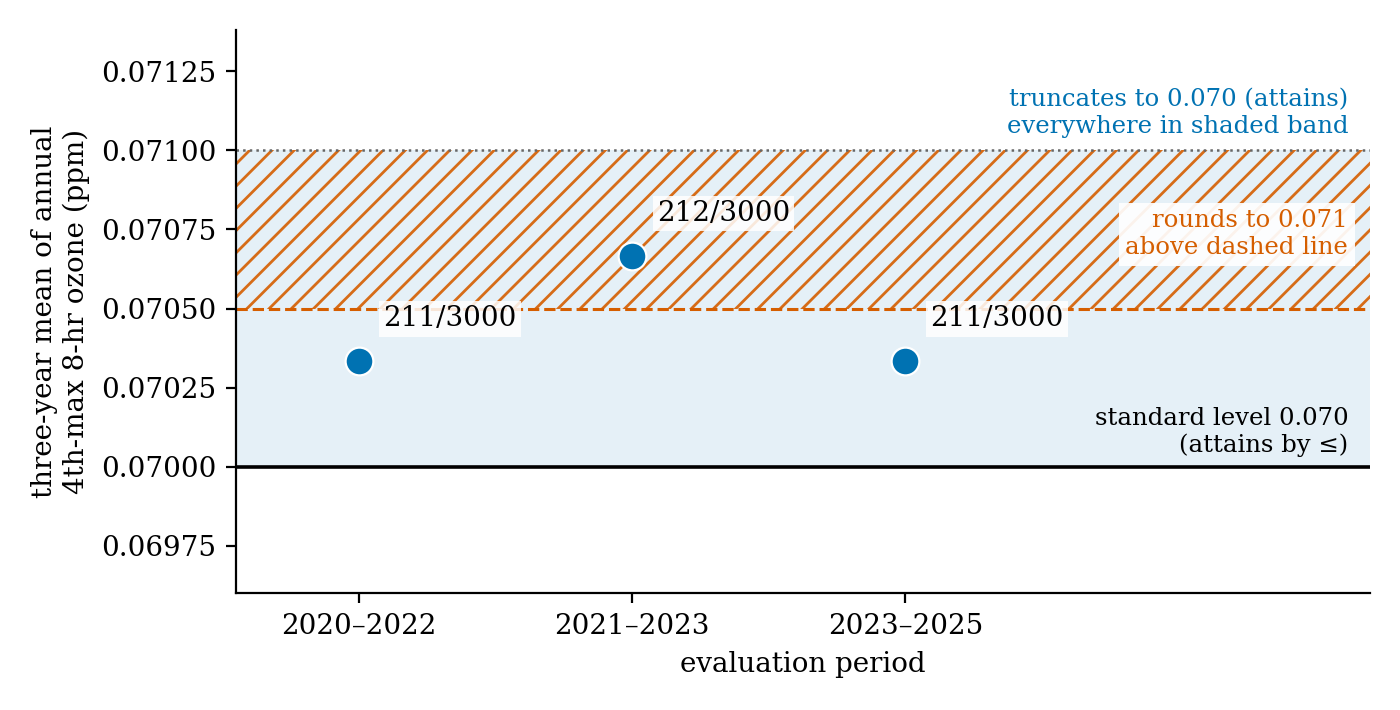
The three attaining three-year means of the New Haven site (site 09-009-0027; it violated at 0.072 in 2022–2024), calculated from the hourly data as exact fractions and plotted on the grid of possible three-year means. In the blue band the truncated value is 0.070 and the site attains; above the orange dashed line at 0.0705 a rounded value would be 0.071, a violation (orange hatching). The outer points, 211/3000 ppm, attain under either convention, though only because a value equal to the level attains; the middle point, 212/3000 = 0.0706…, attains only because the rule truncates and the comparison is inclusive, two conventions at once. (Figure 2 of the paper.)
What turns on the eight-hour truncation
At the Cook County, Illinois, monitor in Chicago (site 17-031-4007) the final digit does not matter at all. As written, its annual fourth-highest values for 2020–2022 are 0.072, 0.069 and 0.070 ppm, the mean is $211/3000$, which truncates (and would also round) to 0.070, and the site attains at 70 ppb. Keep the reported hourly values but round the eight-hour averages and the final value, and each year’s fourth-highest rises by a full thousandth, to 0.073, 0.070 and 0.071; the mean becomes $214/3000$ and the published value 0.071, a violation at 71 ppb. Carry the eight-hour averages untruncated and cut once at the end, as EPA proposed in 2010, and the mean before that final step is $853/12000$ ppm, or 71.08 ppb, above the limit whether the final step truncates or rounds. In the paper’s words, the site can legally sit 1.08 ppb above the written limit, and no treatment of the last digit changes that, because the excess is removed earlier, when the eight-hour averages are truncated. As the paper notes in the same passage, this monitor did not decide its area’s status: the Chicago area’s 2020–2022 design value was 0.075 ppm, set by two other monitors.
Over all 190 valid borderline ozone values, rounding at both steps, procedure (b), changes 148–149 determinations, against 61 for the final digit alone. EPA’s 2010 proposal, (c), changes 140, and (d), which removes only the intermediate truncation, 52–53. (The ranges reflect a choice between two admissible data series for exceptional-eventdays whose data EPA has agreed to exclude from the calculation because an unusual event, such as a wildfire, affected the readings days, which moves the determination at two site-periods.) Every change runs from attainment to violation, since a truncation never increases a number. Counted by core-based statistical area rather than by monitor, most changes would not alter a status, because another monitor of the area already violates, as at Chicago. Of 1,558 areas attaining as published, 17 would violate under a final rounding and 41 under (b).
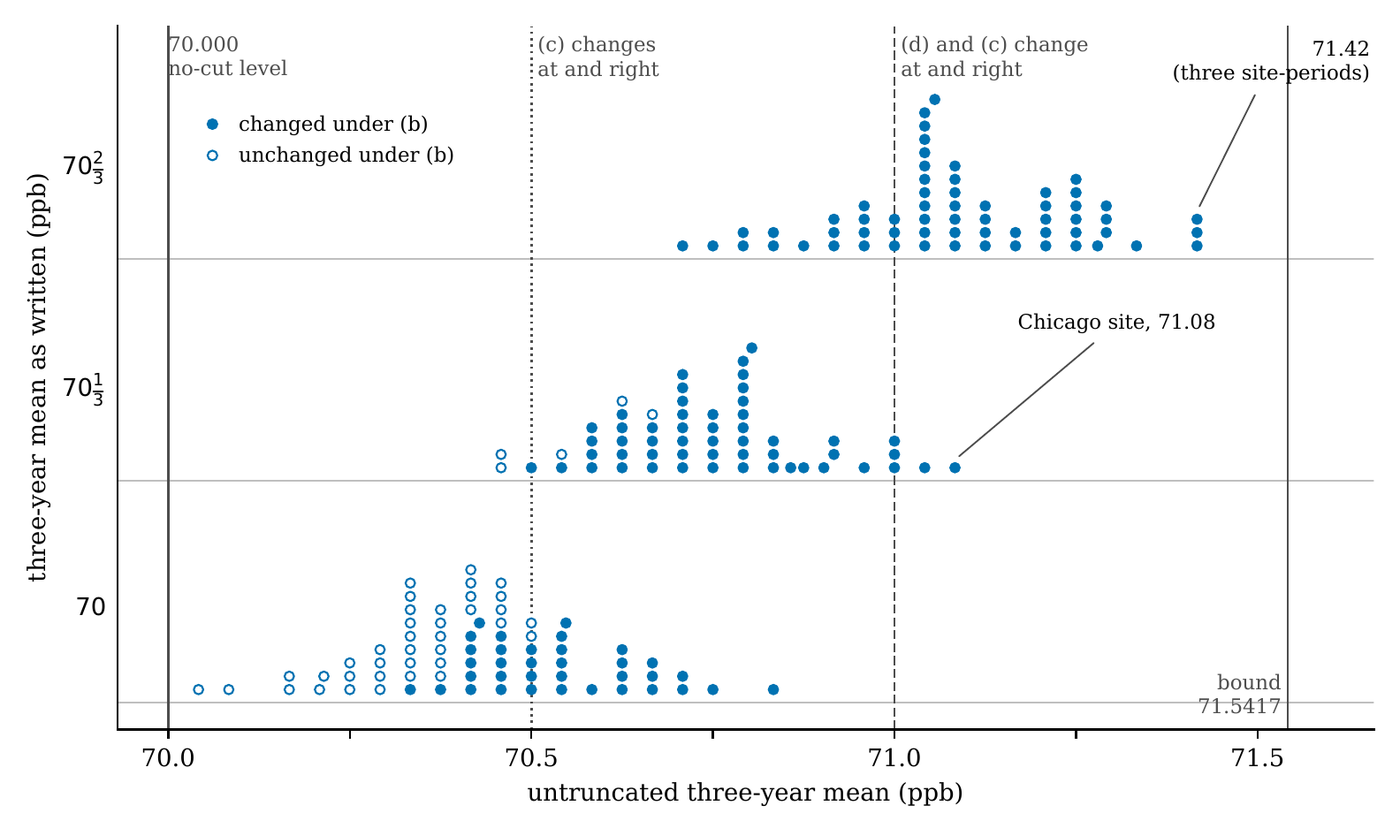
All 190 valid borderline ozone design values of 2020–2025, each drawn at its three-year mean with the eight-hour averages carried untruncated (horizontal axis) and sorted into rows by its three-year mean as written (70, 70⅓ or 70⅔ ppb); the top row holds the 61 values a final rounding alone would change. Every value attains as written, and every one has an untruncated mean above the no-cut level of 70.000 ppb. Filled marks change to violation under procedure (b), rounding at both steps; marks at or right of the dotted line at 70.5 change under (c), EPA’s 2010 proposal; marks at or right of the dashed line at 71.0 change under (d) as well. The solid line at 71.5417 ppb is the largest untruncated mean an attaining value can have when the eight-hour truncation leaves its set of valid days unchanged; the Chicago site at 71.08 and the three site-periods at 71.42 are labeled. (Figure 3 of the paper.)
The largest untruncated mean among the 190 is $857/12000$ ppm, or 71.42 ppb, reached at three site-periods: Kaufman County, Texas (site 48-257-0005, 2022–2024), Hunterdon County, New Jersey, and Suffolk County, New York (both 2023–2025). At Kaufman County the published value is 0.070, and the untruncated mean of the same reported measurements is 1.42 ppb above the written limit. That is nearly three times the half part per billion at issue at the final digit, and under each alternative the site violates. The excess has a ceiling: truncating an eight-hour average discards at most $7/8$ ppb, a loss that the later maxima and means cannot enlarge, and a value that attains as written has a pre-truncation mean, a mean of three integers, of at most $212/3$ ppb. So for a fixed set of valid days the largest untruncated mean an attaining value can have is
$$\frac{212}{3}+\frac{7}{8}\;=\;\frac{1717}{24}\;=\;71.5417\ \mathrm{ppb},$$and the bound can be reached; the observed 71.42 lies just inside it. The simplest alternative of all would carry the computed value through and compare it with the limit once, truncating and rounding nothing. Since the truncations can only lower the value, that is also the strictest reading of the standard, with an effective level of exactly 70.000 ppb.
What the paper does and does not say
No sentence in the paper asserts that any convention is wrong or that any area’s designation is environmentally inappropriate; truncation and rounding each have defensible rationales, and which should govern a legal boundary is a policy question that arithmetic cannot decide. For scale, EPA’s stated uncertainty of the design value, approximately 0.001 ppm, is the width of the whole truncation-versus-rounding band; the paper gives such figures as context only and does not assess the consequences of either convention. Its counts are for site-level design values, not formal area designations.
The paper instead proposes a list: whichever convention is kept, EPA could state beside each design value in its Reports whether the site’s status depends on the treatment of digits, on the inclusive comparison, or on the completeness waiver. Such a list would serve the states that write implementation plans, the industries whose permits turn on a designation, and commenters on both sides, who could aim their argument at the provision on which a particular site depends. Appendix A of the paper contains that list for every valid borderline site-period of 2020–2025. The paper closes with the remark that counts of this kind could be made wherever a legal status is assigned by comparing a computed statistic with a threshold. The sibling pages under Health policy and medicine treat Medicare star ratings and adaptive trial designs.
The paper
- How truncation and rounding affect attainment of the U.S. ozone standard (PDF) — Matthew D. Schwartz; the version on this site is marked preliminary. It recomputes the borderline ozone and PM2.5 design values of 2020–2025 from EPA’s public monitoring data in exact arithmetic and counts how many attainment determinations depend on the truncation of digits, on the inclusive comparison and on the completeness waiver. It also tabulates the record of comment and response on the truncation from 1997 to 2025, and its Appendix A lists, site by site, the provisions each determination depends on.
Supplementary material
Every input is public, but because EPA regenerates its AirData files from its current database, the computation is preserved in a reproducibility package hosted here, with a short checking script and its data extract beside it.
- airquality-record.tar.gz (40.7 MB; SHA-256
b8b11b19…55dd3f) — the reproducibility package: the code, the regulatory text, the digests of all 67 public input files as retrieved, the extracted records of every site counted, every machine-readable result the paper’s numbers are read from, and the independent reimplementations and tests, with a README for checking each number offline. - airquality-record.MANIFEST.sha256 — the package’s file manifest: the SHA-256 of every file inside it.
- airquality-record.RECORD.json — the package’s summary record: build date, file count and sizes, the full SHA-256 of the tarball and the digest of the input-file manifest.
- airquality-evaluate.py — Python 3, standard library only, no network. From the filed hourly readings in the extract below it repeats the design-value calculation exactly for the three monitors used as worked examples in the paper, under the rule as written and under each alternative procedure, and checks the values quoted on this page in about a second, exiting nonzero on any mismatch; a
--checkmode adds controls that must fail, such as one altered hourly reading or one corrupted byte of the data file. - hourly-o3-exhibits.csv.gz — the fixed extract the script reads: the hourly ozone readings, exactly as filed in EPA’s AirData files, for the Cook County (2020–2022), Kaufman County (2022–2024) and New Haven (2020–2025) monitors.
The hourly ozone data of every monitor in the four Design Value Reports (4,929 site-periods) are posted beside the package, one file per year, cut from EPA’s AirData hourly files as retrieved in July 2026: gzipped CSV, no header, six columns (site, POC, date, hour, measurement in ppm as filed, qualifier).
- hourly_o3_2020_all-monitors.csv.gz (31.7 MB,
7b78a2ac) — hourly ozone, 2020; 8,994,779 rows. - hourly_o3_2021_all-monitors.csv.gz (31.7 MB,
c3100c83) — hourly ozone, 2021; 8,952,319 rows. - hourly_o3_2022_all-monitors.csv.gz (31.1 MB,
2956bac2) — hourly ozone, 2022; 8,798,721 rows. - hourly_o3_2023_all-monitors.csv.gz (31.3 MB,
f27c1c55) — hourly ozone, 2023; 8,805,661 rows. - hourly_o3_2024_all-monitors.csv.gz (31.2 MB,
bb1d71b8) — hourly ozone, 2024; 8,794,116 rows. - hourly_o3_2025_all-monitors.csv.gz (31.0 MB,
b717e4e3) — hourly ozone, 2025; 8,695,493 rows. - hourly_o3_2026_all-monitors.csv.gz (51 KB,
1604af72) — 1 January 2026 only; the late eight-hour periods of 31 December 2025 run into it. - daily_o3_all-monitors.json.gz (9.5 MB,
ee0b9fee) — the archived daily eight-hour ozone rows of the same sites, 2020–2025; 2,278,336 rows (site, POC, date, event type, observation count, daily maximum). - MANIFEST-hourly.sha256 — the SHA-256 of each of the eight data files above.
- HOURLY_README.md — the README for these files: the site filter, the source archives, columns and units, and the row counts per year.
References
| D. P. Chock and B. Nance, A Monte-Carlo simulation of the ozone attainment process, Air & Waste 43 (1993) 995 | an early statistical study of the ozone attainment test and its stringency |
| D. P. Chock, Issues regarding the ozone air quality standard and the design value, J. Air Waste Manag. Assoc. 45 (1995) 893 | on the construction of the fourth-highest design value |
| U.S. Environmental Protection Agency, ozone NAAQS final rules, 62 FR 38856 (1997) and 73 FR 16501 (2008) | the two rulemakings in which EPA took comment on the convention and kept it |
| D. Fairley, Overshoot bias and the national ozone standard, J. Air Waste Manag. Assoc. 49 (1999) 370 | concluded that rounding may misclassify nonattainment areas as attainment |
| M. Greenstone, The Impacts of Environmental Regulations on Industrial Activity: Evidence from the 1970 & 1977 Clean Air Act Amendments and the Census of Manufactures, NBER Working Paper 8484 (2001); J. Polit. Econ. (2002) | what nonattainment cost counties in jobs, capital and output, 1972–1987 |
| North Carolina v. EPA, 531 F.3d 896 (D.C. Cir. 2008) | the one lawsuit found in which the digit treatment was contested; truncation upheld |
| U.S. Environmental Protection Agency, ozone reconsideration proposal, section V.G, “Truncation Versus Rounding,” 75 FR 3031 (2010) | EPA’s own proposal to carry all digits and round once; withdrawn in 2011 |
| U.S. Environmental Protection Agency, Responses to Significant Comments on the 2014 Proposed Rule on the NAAQS for Ozone, Docket EPA-HQ-OAR-2008-0699 (2015) | EPA’s answer that the convention was already accounted for in setting the level |
| U.S. Environmental Protection Agency, Determinations of Attainment by the Attainment Date, Extensions of the Attainment Date, and Reclassification of Areas Classified as Marginal for the 2015 Ozone National Ambient Air Quality Standards, final rule, 87 FR 60897 (2022) | the 2022 determinations: Atlanta attained at 0.070, three areas failed at 0.071 |
| Sierra Club, comment EPA-HQ-OAR-2018-0279-0596 (May 31, 2022) | the pending objection: no scientific basis, up to about 1.6 ppb of under-protection |
| Code of Federal Regulations, Title 40, Part 50: National Primary and Secondary Ambient Air Quality Standards, Appendices H, K, N, and U, eCFR, snapshot of 2026-07-16 | the regulation itself: Appendix U truncates for ozone, Appendix N rounds for PM2.5 |