The Great Oxidation (earth science)
The content on this page was written by AI under human supervision.
The rise of oxygen in Earth’s air about 2.4 billion years ago, the Great Oxidation, is usually drawn as a single permanent step. In the paper behind this page, Matthew Schwartz and David Johnston assemble a small ocean–atmosphere model from published measurements and dated rocks. In the model the rise comes as an oscillation paced by four ice ages, on the assumption that oxygen made beneath the ice is consumed there. Oxygen stays for good only from the last thaw, 2.22 billion years ago, a date set by the glacial record the model is calibrated against and by that assumption.
How Earth’s air got its oxygen (7½ minutes) — Matthew Schwartz · David Johnston · Claude: the history of Earth’s atmosphere from a young airless planet to today, and how a model built from published chemistry, climate and rock records finds the rise of oxygen 2.4 billion years ago arriving, on its assumptions, as a flicker paced by four ice ages rather than a single step. Images: NASA, USGS, NOAA and other public domain · CC BY 2.0: G. Churchard, J. St. John, NPS/M. Jenkins, owamux, P. Whitehouse · CC BY 3.0: CSIRO. (Download the video, 14 MB.)
Air without oxygen
Oxygen is a fifth of the air today, yet for roughly the first half of the planet’s four-and-a-half-billion-year history it was almost absent. The change that began about 2.4 billion years ago is the Great Oxidation Event, which textbooks draw as the first permanent step of a staircase up to today’s air.
The clearest evidence for that early lack of oxygen is a signature in sulfur. Most chemistry sorts sulfur’s isotopes, atoms of slightly different weight, in proportion to their weight. Under an oxygen-free sky, ultraviolet sunlight acting on volcanic sulfur gases leaves a pattern that does not follow weight, and sediments lock it into rock. Farquhar, Bao and Thiemens reported this mass-independent fractionation, MIF-S for short, in 2000, in rocks older than the transition and not in younger ones. Photochemical modeling by Pavlov and Kasting in 2002 showed that it survives only when oxygen is below about one hundred-thousandth ($10^{-5}$) of its present level.
Dated rocks on three old continental blocks, the Kola, Kaapvaal and Superior cratonsA craton is an old, stable block of continental crust. The Kaapvaal craton is in South Africa (its Transvaal rocks supply the sulfur record used here), the Superior craton in Canada (home of the Huronian rocks), and the Kola craton in the far north of Europe., now place the transition inside an interval of repeated glaciation. In South Africa the Makganyene glacial deposit, laid down at low latitude, interfingers with the Ongeluk lavas, which Gumsley and colleagues dated in 2017 to about 2,426 million years ago. Higher in the same succession the sulfur anomaly is gone by 2.33 to 2.32 billion years ago. In more densely sampled drill core, though, it returns at least twice, and on that evidence Poulton and colleagues argued in 2021 that it was lost for good only near 2.22. Four glaciations fall in this interval under the current matching of the South African rocks with the Huronian rocks of Canada (three under an older matching). The Great Oxidation is therefore increasingly read as a transition paced by climate.
The authors also ask what the 1,689 published sulfur measurements from South Africa show on their own. The measurements cluster at a few dated ages, so the number of flips between anomaly-bearing and anomaly-free states cannot distinguish one oxic–anoxic cycle (air with oxygen, then without) from six. The case that the anomaly returned rests on the order of samples within individual drill cores, and both the one-step and the oscillating readings were made on the same core, EBA-2.
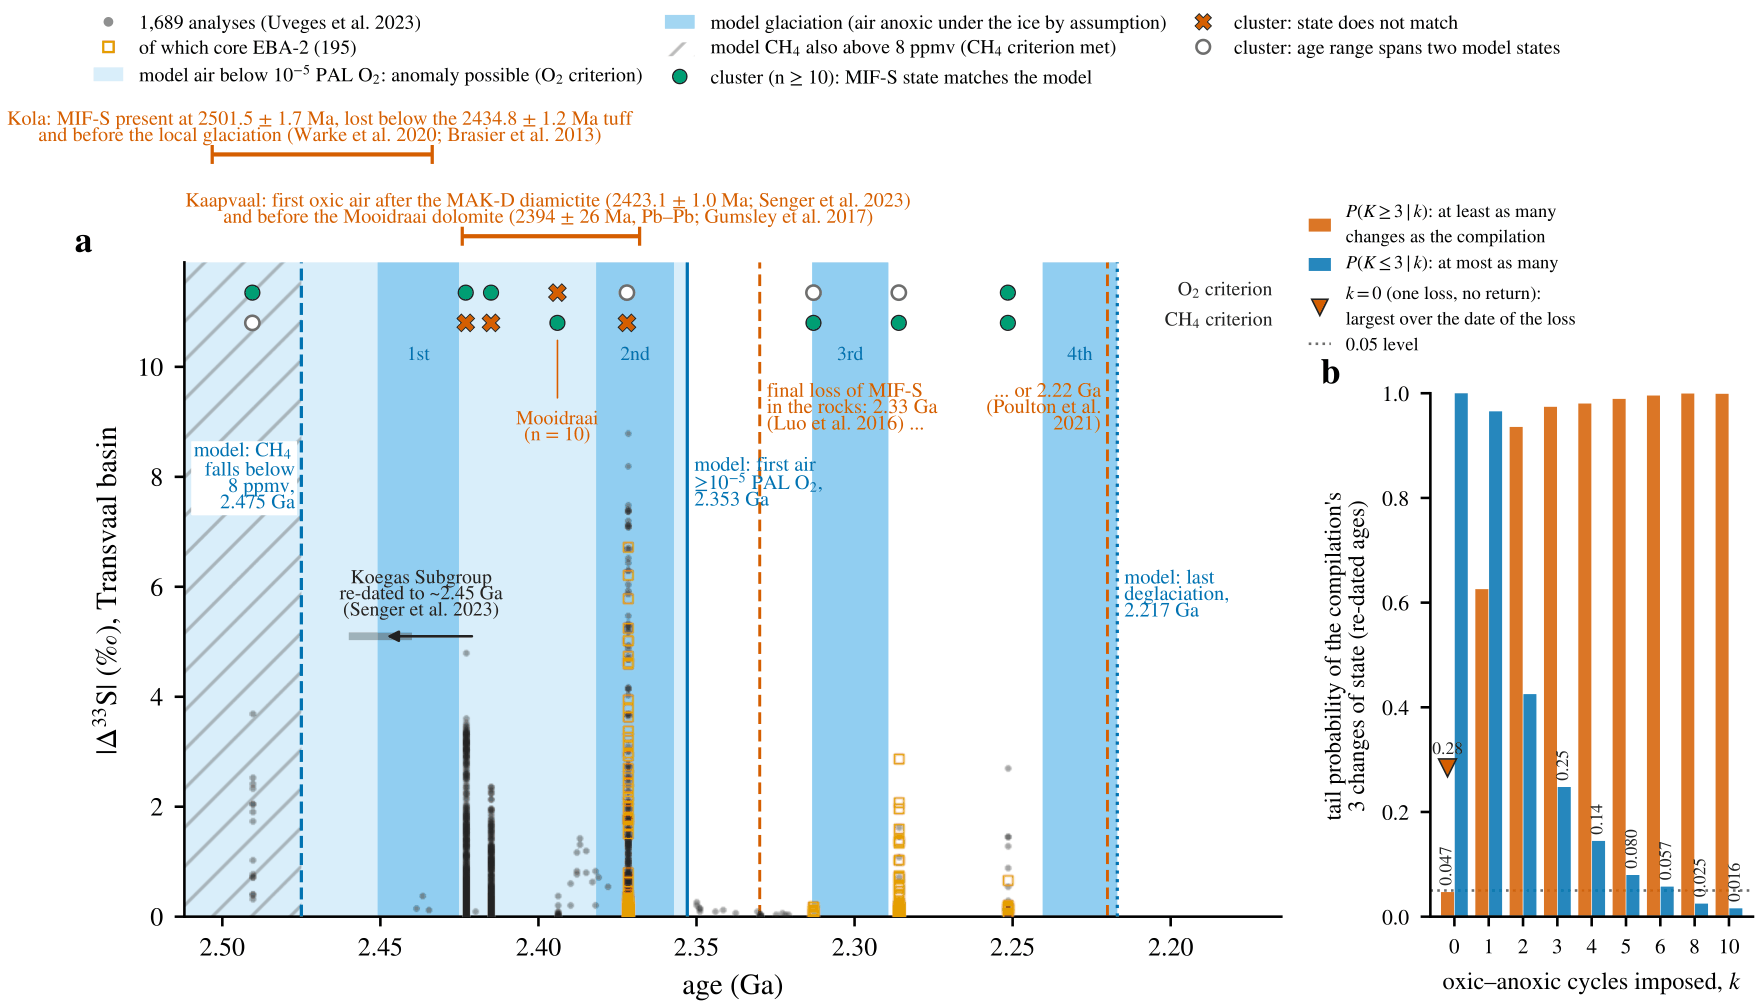
The South African sulfur-isotope record compared with the model. Each gray dot in (a) is one published measurement of the sulfur-isotope anomaly from the Transvaal basin of South Africa, 1,689 in all. Orange squares mark the single drill core, EBA-2, on which both the one-step and the oscillating readings were made. A large anomaly means the sky above was essentially oxygen-free. The blue shading marks where the model described below keeps oxygen under the sulfur-isotope threshold: the darker bands are its four glaciations, oxygen-free by assumption, and the pale region is everything before 2.353 billion years ago. The symbols along the top mark, cluster by cluster, where the rocks and the model agree (green), disagree (crosses) or cannot be compared (open). Panel (b) is a resolution test: binned in five-million-year steps, the compilation changes state three times. Synthetic histories with one to six oxic–anoxic cycles, sampled at the same ages, produce that count often enough that none can be rejected. Only a single loss with no return (for some dates of the loss) and eight or ten short cycles fall below the dotted 5 percent line, so the count of flips does not measure the number of cycles. (Figure 4 of the paper.)
Why methane and ice belong in the story
Photochemical models had established that oxygen and methane destroy each other. Methane is also a greenhouse gas, and under a young Sun fainter than today’s it helped keep the early Earth warm, so losing it could freeze the planet. In a 2006 model by Claire, Catling and Zahnle, whose chemistry Schwartz and Johnston adopt, methane collapsed and recovered repeatedly and the planet froze three times.
In Schwartz and Johnston’s model, the methane came from microbes that make it from hydrogen, and volcanoes supplied the hydrogen; the same volcanic gases also consume oxygen directly. The authors date the decline of that hydrogen supply with the nickel content of banded iron formationsFinely layered iron-rich rocks deposited from ancient seawater, mostly before the Great Oxidation; their chemistry records what the ocean held at the time, here the nickel that volcanic rock delivered., which falls from about 2.7 billion years ago, a decline attributed to the cooling of the planet’s interior. The compilers of that nickel record read the decline as a nickel famine for the methane-makers, which need the metal as a nutrient; the authors read it instead as a hydrogen famine. Between 2.55 and 2.45 billion years ago, in the model’s inputs, the continents rose out of the sea and rain on the newly exposed rock pulled more carbon dioxide from the air.
Ice enters through the carbon cycle. When volcanic carbon dioxide cannot hold a planet above its freezing threshold, ice spreads to the tropics: a snowball glaciation. Under global ice the weathering that removes carbon dioxide stops while volcanoes keep supplying it, so it builds up until the greenhouse melts the ice; hothouse weathering then draws it back down, and the planet can refreeze. Climate models by Tajika in 2007 and others since showed such a planet cycling between frozen and ice-free states with a period set by the outgassing rate. All the while the Sun brightens steadily, which makes freezing harder as time goes on.
The model
The authors couple the processes described above in a deliberately minimal model. The model follows oxygen $O$, methane $N$ and carbon dioxide $C$ in the air, phosphate $P$ in the ocean, and an ice state, from three billion years ago to today. Every input is a published measurement or rate law, a quantity fixed by today’s steady state, a dated history, or a stated assumption varied later. One quantity alone, the outgassing exponent $\nu$ introduced below, is left free, to be fixed by the glacial record. The authors add that their rule for the carbon outgassed under ice, described below, was chosen over an alternative partly because four glaciations occur with it, so the glaciation count calibrates that rule as well. In the paper’s notation, with a dot for a rate of change, the oxygen and methane budgets are
$$ n_{\rm O_2}\,\dot O \;=\; B_{\rm mar} \;-\; 2\,\Omega \;-\; W_{\rm ox}\,O^{1/2} \;-\; R(t) \quad (O\gt 0), \qquad\quad \dot N \;=\; G(t) \;-\; \Omega \;-\; k_{\rm esc}\,N, \qquad\quad \Omega \;=\; k_{\rm eff}(p_{\rm O_2},p_{\rm CH_4})\; n_{\rm O_2}\,O\,N . $$
$O$ is oxygen in units of its present level (the first balance applies while $O$ is above zero), $n_{\rm O_2}$ converts it to moles, and $N$ is the methane inventory; every term is a flux in trillions of moles per year. $B_{\rm mar}$ is marine organic burial, the oxygen source; $\Omega$ the mutual destruction, two oxygen molecules per methane, with a rate coefficient $k_{\rm eff}$ that itself depends on the oxygen and methane partial pressures $p_{\rm O_2}$ and $p_{\rm CH_4}$, taken from the 2006 photochemical model. $W_{\rm ox}\,O^{1/2}$ is the weathering of old organic carbon; $R(t)$ the oxygen-consuming volcanic gas and $G(t)$ the methane made from volcanic hydrogen, both declining along the nickel record; and $k_{\rm esc}N$ the escape of methane’s hydrogen to space. Through the Archean, the eon that ended 2.5 billion years ago, the sinks exceed the source and $O$ stays at essentially zero. The model does not compute when the source first overtakes the sinks; the authors place that epoch at 2.44 billion years ago, inside the window the dated rocks allow.
Carbon dioxide grows by volcanic outgassing and falls by burial and by rock weathering, which strengthens as the continents emerge and stops under ice. Outgassing follows a law published by Krissansen-Totton and colleagues in 2018,
$$ V_{\rm out}(t) \;=\; V_{\rm mod}\left(1-\frac{t}{4.5~{\rm Gyr}}\right)^{-\nu} , $$
with $t$ the age, $V_{\rm mod}$ today’s volcanic carbon flux and $\nu$ an exponent that sets how much harder the young, hotter Earth outgassed; a larger $\nu$ means more early carbon dioxide and, once it is large enough, fewer glaciations. Krissansen-Totton and colleagues allowed $\nu$ anywhere from 0 to 1.46 with no preferred value.
Climate enters through the forcing $F$, the net heating of the planet measured against the pre-industrial Earth, and ice advances when $F$ falls below a threshold:
$$ F(C,p_{\rm CH_4},t) \;=\; F_{\rm CO_2}(C) \;+\; F_{\rm CH_4}(p_{\rm CH_4}) \;-\; \bigl[\,1-s(t)\,\bigr]\,Q_\odot , \qquad\quad F + D^\ast \lt 0 \quad \mbox{(glaciation begins)} . $$
The first two terms are the warming from carbon dioxide and methane, from published radiation calculations; the last is the shortfall in sunlight, $Q_\odot$ being what the Earth absorbs today and $s(t)$ the Sun’s brightness relative to today. $D^\ast$, 10.1 watts per square meter, is the deficit at which a modern climate model runs away to global ice, the most glaciation-prone value published. While the planet is frozen, most of the carbon outgassed under the ice goes into a store that is released at the thaw; the authors count this store among their largest assumptions and name no physical carrier for it. The model also assumes that oxygen and methane made beneath the ice are consumed there, so that its air stays oxygen-free throughout a glaciation.
The glacial record then fixes $\nu$. Requiring at least four glaciations and none after 2.22 billion years ago confines it to 0.7075–0.7225, one percent of the range from 0 to 1.46, where the model has exactly four. With $\nu$ above about 0.8 there is no glaciation at all and oxygen rises once and smoothly, the textbook step. Because $\nu$ comes from counting glaciations, the authors are explicit that the count, the spacing and the date of the last thaw are calibration, not successes.
What comes out
When the model is run forward, its late-Archean air holds about 280 parts per million of methane (about twice that under the paper’s alternative treatment of hydrogen escape). The methane thins to a few parts per million as the hydrogen supply wanes and the continents emerge. At 2.45 billion years ago the planet freezes: the tail of the methane collapse tips a climate that weathering has already cooled almost to the threshold. Carbon dioxide builds under the ice for about 25 million years until the ice melts; weathering then draws the gas down, and about 45 million years later the planet refreezes. The model does this four times between 2.45 and 2.22 billion years ago with no periodic push from outside. This is the climate modelers’ limit cycleA self-sustaining oscillation that a system settles into on its own, with no periodic push from outside: here, carbon dioxide building up under the ice until the ice melts, then being weathered away until the planet freezes again., set running by the methane collapse, and it ends when the brightening Sun keeps the drawdown from reaching the freezing threshold again.
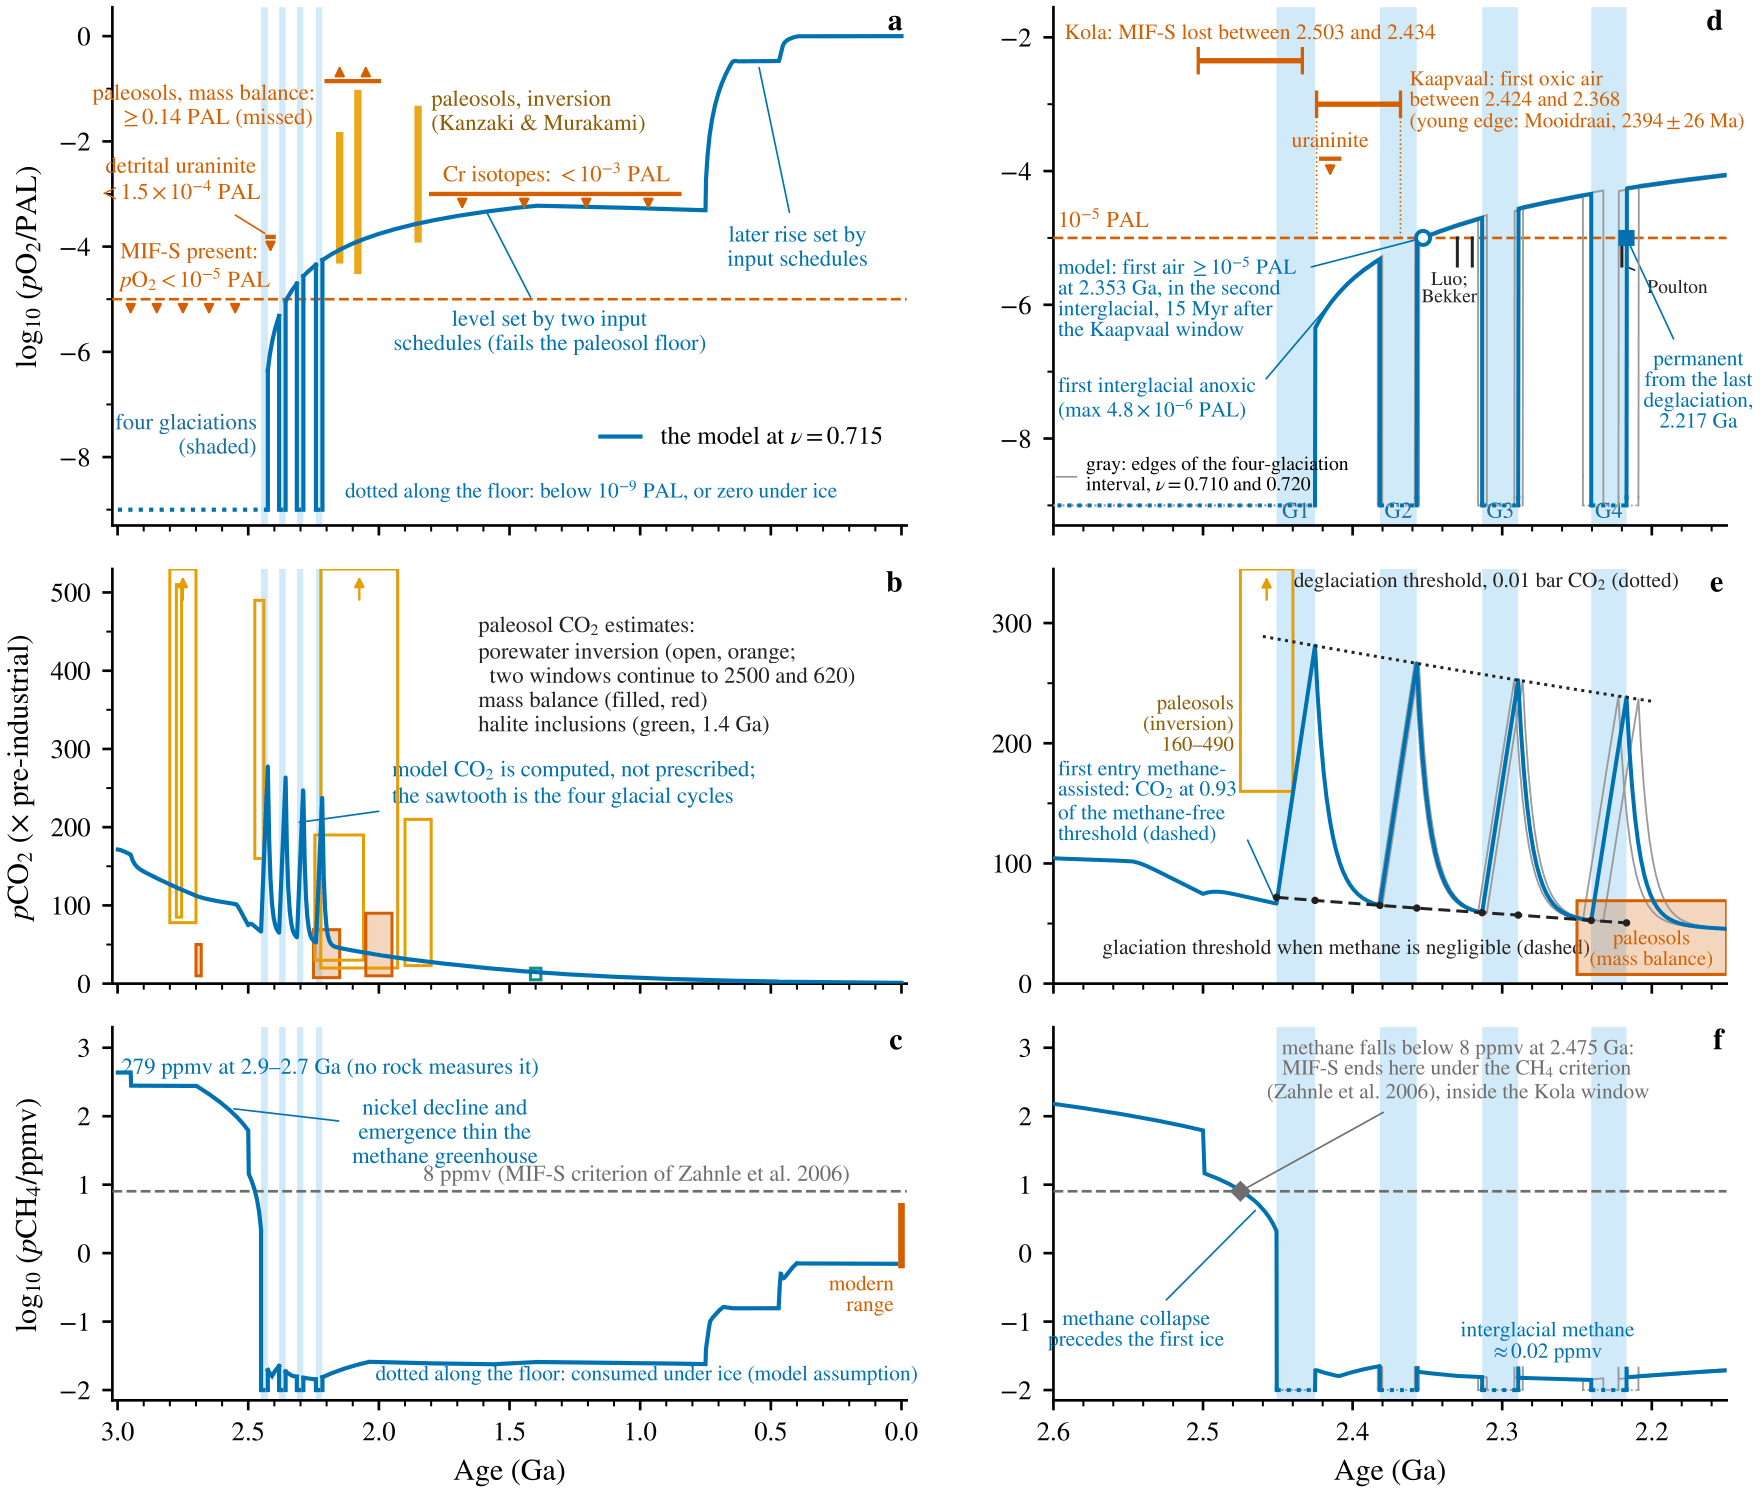
The model’s Earth from three billion years ago to today (left) and across the Great Oxidation (right): oxygen on top, carbon dioxide in the middle, methane at the bottom, with the four glaciations as pale blue bands. Time runs left to right in every panel. Methane (f) collapses just before the first band. Carbon dioxide (e) climbs under each ice cover until the ice melts, then is drawn back down, reaching the freezing threshold again after each of the first three thaws but not after the fourth. Oxygen (d) is zero under the ice by assumption and negligible in the first ice-free interval. It first clears the sulfur-isotope threshold (dashed line, one hundred-thousandth of the present level) at 2.353 billion years ago, in the second interval, comes back higher after each later thaw, and stays from the last one, 2.217, a date that follows from the glaciation count and the under-ice assumption. Orange and red marks are bounds from the rock record; the low oxygen level after the transition in (a) is set by two input schedules, misses the floor that ancient soils require, and is not a claim of the model. PAL is the present atmospheric level of oxygen, MIF-S the mass-independent sulfur-isotope anomaly, ppmv parts per million by volume, Ga billions of years ago. (Figure 5 of the paper, at $\nu=0.715$; gray curves are the two ends of the four-glaciation range of $\nu$.)
Oxygen follows the glacial cycle without driving it. The first ice-free interval is still oxygen-free. Each glaciation returns the air to anoxia only because of the under-ice assumption; without it, the authors say, the glaciations would not interrupt the rise at all. Oxygen first clears the sulfur-isotope threshold at 2.35 billion years ago, early in the second interval. Each later interval is more oxygenated, because the sink from volcanic gases, set after the onset from the carbon-isotope record, keeps declining while burial holds steady. From the fourth thaw, 2.22 billion years ago, oxygen stays. That date follows from the glaciation count and the under-ice assumption and is not claimed as a success.
Against the dated rocks, the model’s calendar of glaciations fits in places and misses in others. The first glaciation, whose start is set by an input, spans the age of the Ongeluk lavas, and the fourth begins after the youngest ash beds beneath the last South African glacial deposit. Neither agreement follows from the count. But the model’s third glaciation ends about 20 million years too late: the Gordon Lake tuffsA tuff is a bed of volcanic ash hardened into rock; zircon crystals in it can be dated precisely by the decay of uranium to lead, which makes tuffs the clocks of a sedimentary succession. in Canada, ash beds on top of the last Huronian glacial deposit, show that the ice was gone by 2.31 billion years ago, and the model keeps it until 2.29. The sulfur record is harder still to match. If the anomaly needs only low oxygen, the model’s first oxic air comes 15 million years later than the South African rocks allow. If it also needs methane above about eight parts per million, as Zahnle and colleagues proposed in 2006, the model loses the anomaly before the first ice. That is too early for anomaly-bearing beds in South Africa, and the later returns to anoxia then leave no sulfur trace. The model also fails to reproduce the Lomagundi–Jatuli excursion near 2.2 billion years ago, a large swing in the carbon-isotope makeup of carbonate rocks, and the oxygen that later iron-retaining paleosolsA paleosol is an ancient soil preserved in the rock record; how much iron it kept or lost while it weathered records the oxygen of the air it formed under, and its other chemistry the carbon dioxide. require, which it misses by a factor of 800 or more. The authors attribute both failures to the absence of any mechanism for an oxygen overshoot.
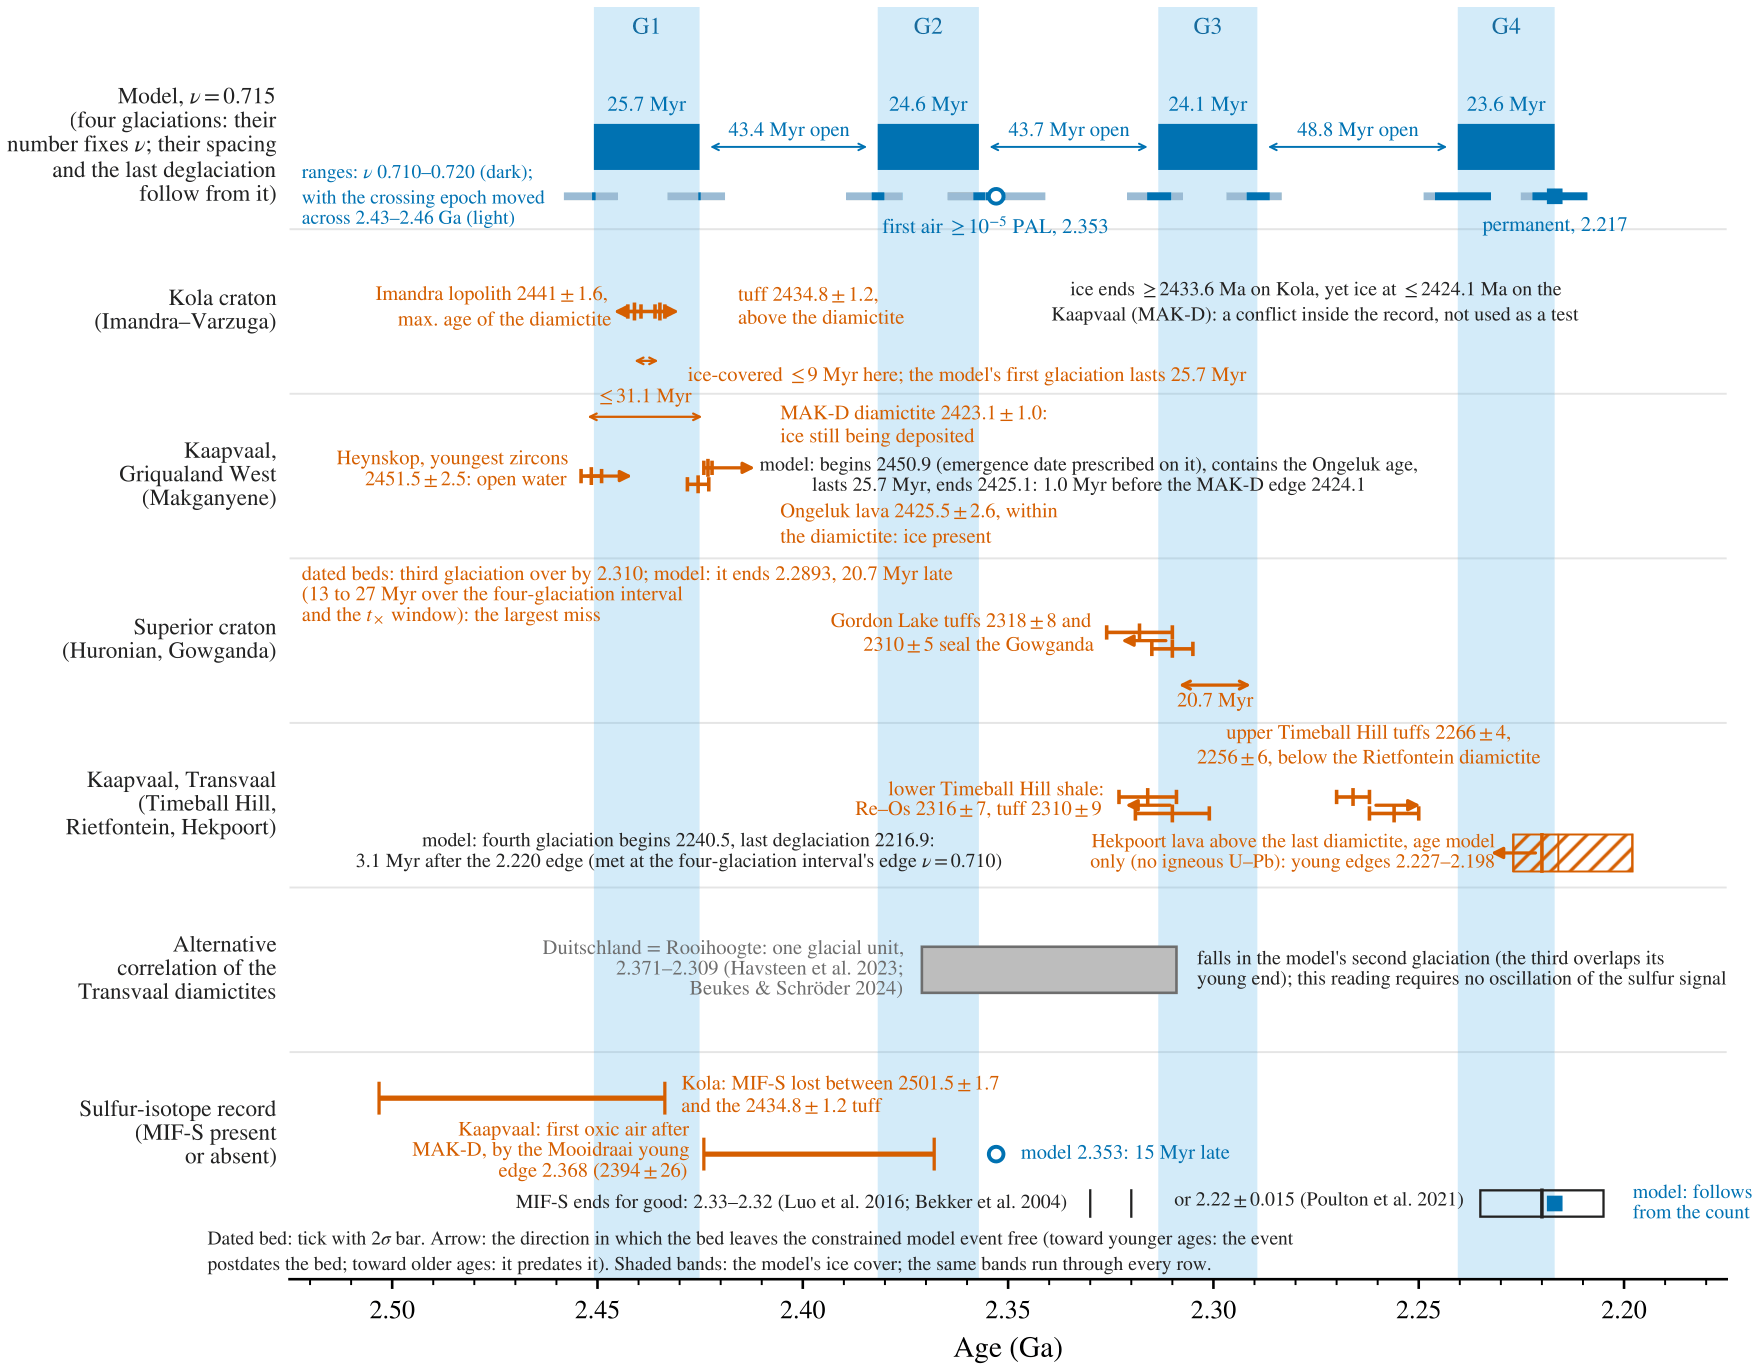
The model’s calendar against the dated rocks. The four blue bands, the same in every row, are the model’s glaciations. Each orange tick is a dated bed with its uncertainty; its arrow points toward the ages that bed allows for the event it constrains. A bed beneath a glacial deposit limits how early the ice began, a lava inside it dates the ice, and a bed above it shows when the ice was gone. The first glaciation, whose start is set by an input, contains the age of the Ongeluk lavas of South Africa, and the fourth begins after the upper Timeball Hill ash beds, two agreements that do not follow from counting glaciations. The third, however, does not end until 20.7 million years after the Gordon Lake ash beds in Canada show that the ice was gone. That is the model’s largest miss, and it depends on the assumed under-ice carbon store. With that carbon locked in ocean crust instead, the model can meet the Gordon Lake date but then misses other dated beds (Table 3 of the paper). In the bottom row the model’s first oxic air, 2.353 billion years ago, comes 15 million years after the South African sulfur record allows. The date of permanent oxygen, 2.217, follows from the glaciation count and the under-ice assumption and is not a test. (Figure 3 of the paper; Ma is millions of years ago, Ga billions.)
Between glaciations the model’s carbon dioxide falls from as much as 253 times the pre-industrial level just after a thaw to as little as 53 times before the next freeze. The high values follow from the assumed melting level and the under-ice carbon store; the minimum is the model’s own prediction. The authors compute carbon dioxide for the two soils from the glacial era with the needed chemistry, near Ville Marie in Quebec and at Hokkalampi in Finland. The ranges for the two soils overlap the model’s, though most central values lie below half its minimum, and because neither soil is yet dated to a particular interval the authors do not count this as a test.
Solving the stepwise model exactly
A prominent modern statement of the staircase picture is the 2019 ocean–atmosphere model of Alcott, Mills and Poulton, in which the planet’s own feedbacks turn a smooth decline in volcanic gases into oxygenation steps. Schwartz and Johnston solve that network exactly for all its steady states (balances in which nothing changes) at the settings Alcott, Mills and Poulton published, and give the working in their supplement. At the settings of that model’s Great Oxidation (with the weakest feedbacks its authors consider) it has exactly one stable state, low in oxygen, and Schwartz and Johnston prove in the supplement that no oxygenated state coexists with it. Driven by its authors’ own declining input it oxygenates once, with no return to anoxia. The same method recovers both states of the two-state 2006 model of Goldblatt, Lenton and Watson.
What is settled and what is open
The authors state their result with two conditions: that volcanic outgassing declined as steeply as the glaciations require, and that oxygen and methane made beneath the ice were consumed there. Given both, they suggest, an episodic first rise of oxygen of the kind Poulton and colleagues inferred follows from published photochemistry and carbon-cycle laws driven by dated inputs. The glaciations also depend on nearly the lowest published freezing threshold, on about one bar of nitrogen, and on continents emerged by 2.38 billion years ago. The model omits the sulfur and iron cycles, carbonate chemistry and ocean geography, and describes the transition only. Because the epoch at which burial overtakes the sinks is taken from the rocks, the model cannot determine whether a rising source or a falling sink produced the Great Oxidation.
The most decisive test would be an age good to a few million years for the end of the third glaciation, at the top of the Gowganda glacial deposit in Canada or the Rooihoogte in South Africa, when the model’s planet is still frozen. A soil dated to an ice-free interval between 2.43 and 2.24 billion years ago would test the carbon cycle; a dated length or spacing of one glaciation would test the under-ice carbon store. Any glacial deposit or renewed sulfur anomaly above the Hekpoort lava, which caps the last South African glacial deposit, would contradict the model outright.
The paper
- The Great Oxidation from a minimal ocean–atmosphere model (PDF) — Matthew D. Schwartz and David T. Johnston; the version on this site is marked preliminary. Describes the model and its inputs, the calibration on the glaciation count, the comparison with the dated rocks and the sulfur-isotope record, the paleosol carbon dioxide estimates, and the exact steady states of the 2019 stepwise model and the 2006 two-state model.
Supplementary material
- Supplementary material (PDF) — the 89-page supplement, Texts S0–S8 with their own figures, tables and reference list: symbols and units, the full model and its present-day closure, the inputs and their sources, the geological data tables and the comparisons with the rock record, the sensitivity studies, an imposed Lomagundi excursion, the phosphorus ceiling, the exact steady states of the two published models, and the paleosol carbon dioxide calculations.
The supplement listed above is the only supplementary file on this site so far; its Text S3 tabulates the geological data with their sources. According to the paper’s data-availability statement, the model code, the input tables, the model output behind each figure and table, and the code and interval-arithmetic output of the steady-state enumerations accompany the journal submission as a supplementary archive and will be deposited in a public repository, with a DOI, on acceptance.
References
| J. Farquhar, H. Bao and M. Thiemens, Atmospheric influence of Earth’s earliest sulfur cycle, Science 289 (2000) 756 | the mass-independent sulfur-isotope anomaly in rocks older than the transition |
| A. A. Pavlov and J. F. Kasting, Mass-independent fractionation of sulfur isotopes in Archean sediments: strong evidence for an anoxic Archean atmosphere, Astrobiology 2 (2002) 27 | the anomaly survives only with oxygen below a hundred-thousandth of its present level |
| A. P. Gumsley, K. R. Chamberlain, W. Bleeker, U. Söderlund, M. O. de Kock, E. R. Larsson and A. Bekker, Timing and tempo of the Great Oxidation Event, Proc. Natl. Acad. Sci. USA 114 (2017) 1811 | the Ongeluk lava age, about 2,426 million years, that dates the first glaciation |
| A. Bekker, H. D. Holland, P.-L. Wang, D. Rumble III, H. J. Stein, J. L. Hannah, L. L. Coetzee and N. J. Beukes, Dating the rise of atmospheric oxygen, Nature 427 (2004) 117 | the one-step loss of the anomaly by 2.32 billion years ago, read on drill core EBA-2 |
| G. Luo, S. Ono, N. J. Beukes, D. T. Wang, S. Xie and R. E. Summons, Rapid oxygenation of Earth’s atmosphere 2.33 billion years ago, Sci. Adv. 2 (2016) e1600134 | the anomaly gone by 2.33 billion years ago, the earlier of the two loss dates marked in the first figure |
| S. W. Poulton, A. Bekker, V. M. Cumming, A. L. Zerkle, D. E. Canfield and D. T. Johnston, A 200-million-year delay in permanent atmospheric oxygenation, Nature 592 (2021) 232 | the anomaly returns in drill core; oxygen permanent only near 2.22 billion years ago |
| B. T. Uveges, G. Izon, S. Ono, N. J. Beukes and R. E. Summons, Reconciling discrepant minor sulfur isotope records of the Great Oxidation Event, Nat. Commun. 14 (2023) 279 | compiled the 1,689 South African sulfur-isotope analyses plotted in the first figure |
| M. W. Claire, D. C. Catling and K. J. Zahnle, Biogeochemical modelling of the rise in atmospheric oxygen, Geobiology 4 (2006) 239 | the oxygen–methane photochemistry the model adopts; its planet froze three times |
| K. Zahnle, M. Claire and D. Catling, The loss of mass-independent fractionation in sulfur due to a Palaeoproterozoic collapse of atmospheric methane, Geobiology 4 (2006) 271 | the proposal that keeping the anomaly also needs methane above about 8 parts per million |
| E. Tajika, Long-term stability of climate and global glaciations throughout the evolution of the Earth, Earth Planets Space 59 (2007) 293 | a planet short of volcanic carbon dioxide cycles between frozen and ice-free states |
| J. Krissansen-Totton, G. N. Arney and D. C. Catling, Constraining the climate and ocean pH of the early Earth with a geological carbon cycle model, Proc. Natl. Acad. Sci. USA 115 (2018) 4105 | the carbon-cycle and outgassing laws, with the exponent $\nu$ left anywhere from 0 to 1.46 |
| B. Rasmussen, J.-W. Zi and A. Bekker, New U-Pb zircon tuff ages and revised stratigraphic correlations in the Superior craton during the Great Oxidation Episode, Earth Planet. Sci. Lett. 640 (2024) 118779 | the Gordon Lake tuff ages that the model’s third glaciation overruns by about 20 million years |
| L. J. Alcott, B. J. W. Mills and S. W. Poulton, Stepwise Earth oxygenation is an inherent property of global biogeochemical cycling, Science 366 (2019) 1333 | the stepwise model whose steady states are solved exactly in the supplement |
| C. Goldblatt, T. M. Lenton and A. J. Watson, Bistability of atmospheric oxygen and the Great Oxidation, Nature 443 (2006) 683 | the two-state model; the same exact method recovers both of its states |